|
2200
|
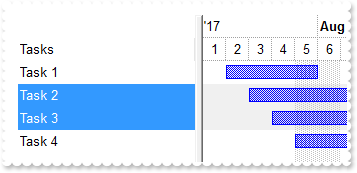
How can I delete the selected items (including descendants)
/*begin event KeyDown(integer  KeyCode, integer  Shift) - Occurs when the user presses a key while an object has the focus.*/
/*
	oG2antt = ole_1.Object
	oG2antt.RemoveSelection()
*/
/*end event KeyDown*/

OleObject oG2antt,var_Chart,var_Items
any h

oG2antt = ole_1.Object
oG2antt.BeginUpdate()
oG2antt.SingleSel = false
oG2antt.Columns.Add("Tasks")
var_Chart = oG2antt.Chart
	var_Chart.FirstVisibleDate = 2017-08-01
	var_Chart.LevelCount = 2
	var_Chart.PaneWidth(false,128)
	var_Chart.SelBackColor = RGB(240,240,240)
var_Items = oG2antt.Items
	var_Items.AddBar(var_Items.AddItem("Task 1"),"Task",2017-08-02,2017-08-06)
	h = var_Items.AddItem("Task 2")
	var_Items.AddBar(h,"Task",2017-08-03,2017-08-09)
	var_Items.SelectItem(h,true)
	h = var_Items.AddItem("Task 3")
	var_Items.AddBar(h,"Task",2017-08-04,2017-08-13,"")
	var_Items.SelectItem(h,true)
	var_Items.AddBar(var_Items.AddItem("Task 4"),"Task",2017-08-05,2017-08-16)
oG2antt.EndUpdate()
|
|
2199
|
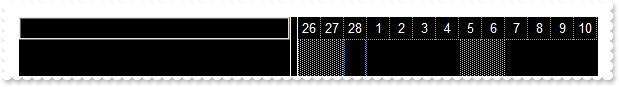
Dark mode
OleObject oG2antt,var_Chart
any back,fore

oG2antt = ole_1.Object
oG2antt.BeginUpdate()
back = 65536
fore = 16777215
oG2antt.VisualAppearance.Add(1,"gBFLBCJwBAEHhEJAAEhABXUIQAAYAQGKIcBiAKBQAGYBIJDEMgzDDAUBjKKocQTC4AIQjCK4JDKHYJRpHEZyCA8EhqGASRAFUQBYiWE4oSpLABQaK0ZwIGyRIrkGQgQgmPYDSDNU4zVIEEglBI0TDNczhNDENgtGYaJqHIYpZBcM40TKkEZoSIITZcRrOEBiRL1S0RBhGcRUHZlWzdN64LhuK47UrWdD/XhdVzXRbjfz1Oq+bxve48Br7A5yYThdr4LhOFQ3RjIL4xbIcUwGe6VZhjOLZXjmO49T69HTtOCYBEBA")
oG2antt.VisualAppearance.Add(2,"gBFLBCJwBAEHhEJAAEhABPMIQAAYAQGKIcBiAKBQAGaAoDDcMgwQwAAxjIKUEwsACEIrjKCYVgOHYYQjGMZwHCMIhiGwcAChEZYHgkMYmDAMUhSE78axHG6PY7kKZ4biaKIqQLLEhSfJ0YyBECBZpfebIbjmIZMSLEIxDKItJSpCIaRgqWS6ahGO4JUbUFLQHT9IR4daIYRgEEBA")
oG2antt.VisualAppearance.Add(3,"gBFLBCJwBAEHhEJAAEhABUUIQAAYAQGKIcBiAKBQAGaAoDDcMgwQwAAxjIKUEwsACEIrjKCYVgOHYYQjGMZwGAsEwjAoYAChEaILgkMw2DBIQwgJIMEr/G6RZxjeL5CjmG4nDhKMpybAcXxjBIYZJgOQpXb+PobTrNNLzfRFAxVAaWJikcZ4HpIAJNVLFdQ0XYMNSBISsBqrKiKcpeIIDWBZMbRZT1ZABCIZBpEW6LahENQwXrCN74DYkNTdKaxbbuaaXLhGCYBgIA==")
oG2antt.HeaderAppearance = 5
oG2antt.BackColor = back
oG2antt.BackColorHeader = back
oG2antt.BackColorLevelHeader = back
oG2antt.BackColorSortBar = back
oG2antt.BackColorSortBarCaption = back
oG2antt.FilterBarBackColor = back
oG2antt.FilterBarForeColor = fore
oG2antt.ForeColor = fore
oG2antt.ForeColorHeader = fore
oG2antt.ForeColorSortBar = fore
oG2antt.SelBackColor = fore
oG2antt.SelForeColor = back
oG2antt.Background(0,16777216 /*0x1000000*/)
oG2antt.Background(18,33554432 /*0x2000000*/)
oG2antt.Background(32,-1)
oG2antt.Background(64,50331648 /*0x3000000*/)
oG2antt.Background(65,back)
oG2antt.Background(66,fore)
oG2antt.Background(20,fore)
oG2antt.Background(21,back)
oG2antt.Background(26,back)
oG2antt.Background(27,fore)
oG2antt.Background(28,back)
oG2antt.Background(142,33554432 /*0x2000000*/)
oG2antt.Background(141,33554432 /*0x2000000*/)
oG2antt.Background(186,fore)
oG2antt.Background(511,back)
oG2antt.Description(25,"<bgcolor 0><fgcolor ffffff> Exclude </fgcolor></bgcolor>")
var_Chart = oG2antt.Chart
	var_Chart.BackColor = back
	var_Chart.BackColorLevelHeader = back
	var_Chart.ForeColor = fore
	var_Chart.ForeColorLevelHeader = fore
oG2antt.EndUpdate()
|
|
2198
|
I have changed the font, but the item's height remains the same. What I am doing wrong
OleObject oG2antt

oG2antt = ole_1.Object
oG2antt.BeginUpdate()
oG2antt.ColumnAutoResize = false
oG2antt.LoadXML("http://www.exontrol.net/testing.xml")
oG2antt.Font.Size = 22
oG2antt.HeaderHeight = 42
oG2antt.DefaultItemHeight = 36
oG2antt.Items.ItemHeight(0,oG2antt.DefaultItemHeight)
oG2antt.Chart.UnitWidth = oG2antt.DefaultItemHeight
oG2antt.Chart.UnitScale = oG2antt.Chart.UnitScale
oG2antt.Chart.Bars.Item("Task").Height = 18
oG2antt.EndUpdate()
|
|
2197
|
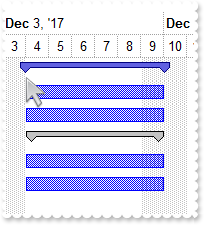
I have changed from Project Summary Task to own task created with EBN to get a black frame then using different colors for project status. How can I enlarge the EBN being applied to the head-arrows shows the start/end margins of the range
/*begin event AddGroupItem(long  Item) - Occurs after a new Group Item has been inserted to Items collection.*/
/*
	OleObject var_Items
	oG2antt = ole_1.Object
	var_Items = oG2antt.Items
		var_Items.ItemBold(Item,true)
		var_Items.AddBar(Item,var_Items.CellValue(Item,var_Items.GroupItem(Item)),2017-12-02,2017-12-02)
		var_Items.DefineSummaryBars(Item,"",-3,"")
*/
/*end event AddGroupItem*/

/*begin event AddItem(long  Item) - Occurs after a new Item has been inserted to Items collection.*/
/*
	oG2antt = ole_1.Object
	oG2antt.Items.AddBar(Item,"Task",2017-12-04,2017-12-10)
*/
/*end event AddItem*/

OleObject oG2antt,var_Appearance,var_Chart,var_Columns,var_Items

oG2antt = ole_1.Object
oG2antt.BeginUpdate()
var_Appearance = oG2antt.VisualAppearance
	var_Appearance.Add(1,"gBFLBCJwBAEHhEJAAEhABN0GACAADACAxRDgMQBQKAAzQFAYbBuGCGAAGIYBTgmFgAQhFcZQSKUOQTDKNYykCQBQAWCQ1DAJIqjOAkEhiGCUQClYYZBjWG4dQLOEYTNC8WwHCIZBpEWgKChGKAlSANMjTZLkdR1ECmIhoSg4coKMoERBJco1BDdOQGAyEQShEC4fgmVwAP7aNoWVC1JynM6XaKmGbJAA6CZgQKGFh2LAdTzSf61cAtWpaUjmRZaYSAFDxpiCYpfQjdUB2JDVfTVP6LbawS4KZgOR5eRboETYeAFcSZGrNMKEXLLSyudKRRreWQaPpGCZTRSUdZxSrbBhvEqlbRNMhwSBEEigNIxToOU4jFgeCROQwQRK9BBoG0CQUEIdhAAyJJvjUeZdmmb5+C8HhiAeZJznoPQ+EgT4rlua4BjCfg+k8d5TkUCZ4w+fxfB+X5xn4fheGebZoH8X53koAR9CASAWAUfofjgJgKH+IJHnGcIDmER5iBEeZgmgVgLgGYYYGoFRTCGaIGAYRYiCiFgmgmYQEF4KIKmKSBRBqCxjAiRgvgwYxIiGQYNmOCJlDUOpeAQBCAg=")
	var_Appearance.Add(2,"CP:1 -6 0 6 0")
var_Chart = oG2antt.Chart
	var_Chart.LevelCount = 2
	var_Chart.FirstVisibleDate = 2017-12-02
	var_Chart.PaneWidth(false,342)
	var_Chart.Bars.Add("S1").Color = 16777216 /*0x1000000*/
	var_Chart.Bars.Add("S2").Color = 50266112 /*0x2ff0000*/
var_Columns = oG2antt.Columns
	var_Columns.Add("C1")
	var_Columns.Add("C2").AllowSort = false
oG2antt.SingleSort = false
oG2antt.AllowGroupBy = true
oG2antt.HeaderVisible = 1
oG2antt.HeaderAppearance = 1
var_Items = oG2antt.Items
	var_Items.CellValue(var_Items.AddItem("S1"),1,"SubItem A.1")
	var_Items.CellValue(var_Items.AddItem("S1"),1,"SubItem A.1")
	var_Items.CellValue(var_Items.AddItem("S2"),1,"SubItem B.1")
	var_Items.CellValue(var_Items.AddItem("S2"),1,"SubItem B.1")
oG2antt.Layout = "MultipleSort = " + CHAR(34) + "C0:2" + CHAR(34) + ""
oG2antt.EndUpdate()
|
|
2196
|
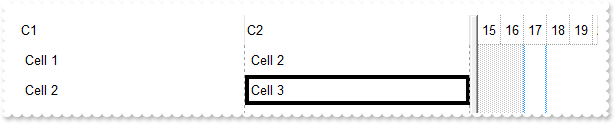
How can I specify the cell's outline, border or lines around, when the cell gets selected
OleObject oG2antt,var_Appearance,var_Items

oG2antt = ole_1.Object
oG2antt.BeginUpdate()
oG2antt.AttachTemplate("handle AddColumn(Column){Column{Def(48)=4;Def(49)=4;}}")
var_Appearance = oG2antt.VisualAppearance
	var_Appearance.Add(1,"gBFLBCJwBAEHhEJAAEhABPEGACAADACAxRDgMQBQKAAzQFAYbBuGCGAAGIYBTgmFgAQhFcZQSpEEg7BKMYwjOJgFgmEQxDANIBQSKoaQiGQYYLhEZAEiONoaDJCM4wHIMQxHCKTZRkGcfaRCGSfIzpGKpVgOTYiTbPcIyQKtBxDIydJTmeQQQhsFIJU7SdVUPDUJZlWbLAwWTAYazXCKRZBpeJqdo6Y5RUDKUqSdLUYyvEq7ZqnOIpw5vICpaCqOp6HqKFpiXSAFL1fLmAwvPKrJjoeqpWpyCaRZQAGg4dbEdTNNCIbatQANKrCSpgZ7sMB6Di2L4TPS2awoWgRYyTFZMbBAeQ7LC1c45Fqrd4zS4dSxKCahcLxFiaNpYZYnjUap1jGPJlkuAgAkidB3nceZsCQEQJCgGhMGcQ4pkiSxEAAOYpiQIhvkYNA2gSCg5n+LIoGILowFyXQoAYAoAmASAWAaAZgggJgKF2T54DYDoDmECBGBKBJgGgTgWgWYRoFYGIGmGOBqByB5hCgegggiYJYgoJIICIaIeByChixULILGGGAWDCCgjCiTgrg0YxojoC4OmOSJ2D6D5kAgJLFgABAEICA=")
	var_Appearance.Add(2,"CP:1 -4 0 0 0")
oG2antt.SelBackColor = 33554432 /*0x2000000*/
oG2antt.SelForeColor = RGB(0,0,1)
oG2antt.FullRowSelect = 0
oG2antt.ShowFocusRect = false
oG2antt.DefaultItemHeight = 24
oG2antt.HeaderHeight = 24
oG2antt.DrawGridLines = 2
oG2antt.Columns.Add("C1")
oG2antt.Columns.Add("C2")
var_Items = oG2antt.Items
	var_Items.CellValue(var_Items.AddItem("Cell 1"),1,"Cell 2")
	var_Items.CellValue(var_Items.AddItem("Cell 3"),1,"Cell 4")
oG2antt.Items.SelectPos = 1
oG2antt.SelectColumnIndex = 1
oG2antt.EndUpdate()
|
|
2195
|
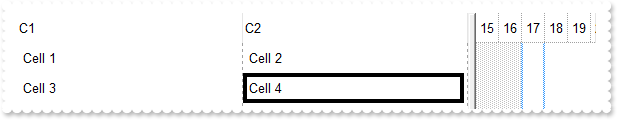
How can I specify the cell's outline, border or lines around, when the item gets selected
OleObject oG2antt,var_Items

oG2antt = ole_1.Object
oG2antt.BeginUpdate()
oG2antt.AttachTemplate("handle AddColumn(Column){Column{Def(48)=4;Def(49)=4;}}")
oG2antt.VisualAppearance.Add(1,"gBFLBCJwBAEHhEJAAEhABPEGACAADACAxRDgMQBQKAAzQFAYbBuGCGAAGIYBTgmFgAQhFcZQSpEEg7BKMYwjOJgFgmEQxDANIBQSKoaQiGQYYLhEZAEiONoaDJCM4wHIMQxHCKTZRkGcfaRCGSfIzpGKpVgOTYiTbPcIyQKtBxDIydJTmeQQQhsFIJU7SdVUPDUJZlWbLAwWTAYazXCKRZBpeJqdo6Y5RUDKUqSdLUYyvEq7ZqnOIpw5vICpaCqOp6HqKFpiXSAFL1fLmAwvPKrJjoeqpWpyCaRZQAGg4dbEdTNNCIbatQANKrCSpgZ7sMB6Di2L4TPS2awoWgRYyTFZMbBAeQ7LC1c45Fqrd4zS4dSxKCahcLxFiaNpYZYnjUap1jGPJlkuAgAkidB3nceZsCQEQJCgGhMGcQ4pkiSxEAAOYpiQIhvkYNA2gSCg5n+LIoGILowFyXQoAYAoAmASAWAaAZgggJgKF2T54DYDoDmECBGBKBJgGgTgWgWYRoFYGIGmGOBqByB5hCgegggiYJYgoJIICIaIeByChixULILGGGAWDCCgjCiTgrg0YxojoC4OmOSJ2D6D5kAgJLFgABAEICA=")
oG2antt.SelBackColor = 16777216 /*0x1000000*/
oG2antt.SelForeColor = RGB(0,0,1)
oG2antt.ShowFocusRect = false
oG2antt.DefaultItemHeight = 24
oG2antt.HeaderHeight = 24
oG2antt.DrawGridLines = 2
oG2antt.Columns.Add("C1")
oG2antt.Columns.Add("C2")
var_Items = oG2antt.Items
	var_Items.CellValue(var_Items.AddItem("Cell 1"),1,"Cell 2")
	var_Items.CellValue(var_Items.AddItem("Cell 3"),1,"Cell 4")
	var_Items.SelectPos = 1
oG2antt.EndUpdate()
|
|
2194
|
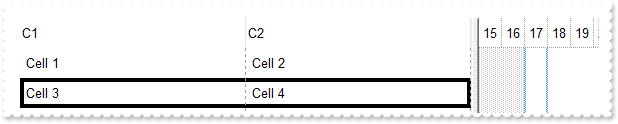
How can I specify the cell's outline, border or lines around
OleObject oG2antt,var_Items
any h

oG2antt = ole_1.Object
oG2antt.BeginUpdate()
oG2antt.AttachTemplate("handle AddColumn(Column){Column{Def(48)=4;Def(49)=4;}}")
oG2antt.VisualAppearance.Add(1,"gBFLBCJwBAEHhEJAAEhABPEGACAADACAxRDgMQBQKAAzQFAYbBuGCGAAGIYBTgmFgAQhFcZQSpEEg7BKMYwjOJgFgmEQxDANIBQSKoaQiGQYYLhEZAEiONoaDJCM4wHIMQxHCKTZRkGcfaRCGSfIzpGKpVgOTYiTbPcIyQKtBxDIydJTmeQQQhsFIJU7SdVUPDUJZlWbLAwWTAYazXCKRZBpeJqdo6Y5RUDKUqSdLUYyvEq7ZqnOIpw5vICpaCqOp6HqKFpiXSAFL1fLmAwvPKrJjoeqpWpyCaRZQAGg4dbEdTNNCIbatQANKrCSpgZ7sMB6Di2L4TPS2awoWgRYyTFZMbBAeQ7LC1c45Fqrd4zS4dSxKCahcLxFiaNpYZYnjUap1jGPJlkuAgAkidB3nceZsCQEQJCgGhMGcQ4pkiSxEAAOYpiQIhvkYNA2gSCg5n+LIoGILowFyXQoAYAoAmASAWAaAZgggJgKF2T54DYDoDmECBGBKBJgGgTgWgWYRoFYGIGmGOBqByB5hCgegggiYJYgoJIICIaIeByChixULILGGGAWDCCgjCiTgrg0YxojoC4OmOSJ2D6D5kAgJLFgABAEICA=")
oG2antt.SelBackMode = 1
oG2antt.ShowFocusRect = false
oG2antt.DefaultItemHeight = 24
oG2antt.HeaderHeight = 24
oG2antt.DrawGridLines = 2
oG2antt.Columns.Add("C1")
oG2antt.Columns.Add("C2")
var_Items = oG2antt.Items
	var_Items.CellValue(var_Items.AddItem("Cell 1"),1,"Cell 2")
	h = var_Items.AddItem("Cell 2")
	var_Items.CellValue(h,1,"Cell 3")
	var_Items.CellBackColor(h,1,16777216 /*0x1000000*/)
oG2antt.EndUpdate()
|
|
2193
|
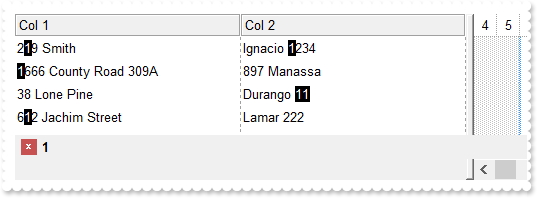
Is it possible to highligth the match while a filter is applied
/*begin event AddColumn(oleobject  Column) - Fired after a new column has been added.*/
/*
	Column.Def(17) = 1
	oG2antt = ole_1.Object
*/
/*end event AddColumn*/

/*begin event FilterChange() - Occurs when the filter was changed.*/
/*
	any format
	oG2antt = ole_1.Object
	format = oG2antt.FormatABC("`value replace '` + value + `' with '<bgcolor 000000><fgcolor FFFFFF>` + value  + `</fgcolor></bgcolor>'`",oG2antt.FilterBarPromptPattern)
	oG2antt.Columns.Item(0).FormatColumn = String(format)
	oG2antt.Columns.Item(1).FormatColumn = String(format)
*/
/*end event FilterChange*/

OleObject oG2antt,var_Items

oG2antt = ole_1.Object
oG2antt.BeginUpdate()
oG2antt.DrawGridLines = 2
oG2antt.HeaderAppearance = 4
oG2antt.Columns.Add("Col 1")
oG2antt.Columns.Add("Col 2")
var_Items = oG2antt.Items
	var_Items.CellValue(var_Items.AddItem("219 Smith"),1,"Ignacio 1234")
	var_Items.CellValue(var_Items.AddItem("1666 County Road 309A"),1,"897 Manassa")
	var_Items.CellValue(var_Items.AddItem("38 Lone Pine"),1,"Durango 11")
	var_Items.CellValue(var_Items.AddItem("612 Jachim Street"),1,"Lamar 222")
oG2antt.FilterBarPromptPattern = "1"
oG2antt.FilterBarPromptVisible = 2067 /*exFilterBarCompact | exFilterBarSingleLine | exFilterBarVisible | exFilterBarPromptVisible*/
oG2antt.FilterBarPromptType = 257 /*exFilterPromptCaseSensitive | exFilterPromptContainsAll*/
oG2antt.EndUpdate()
|
|
2192
|
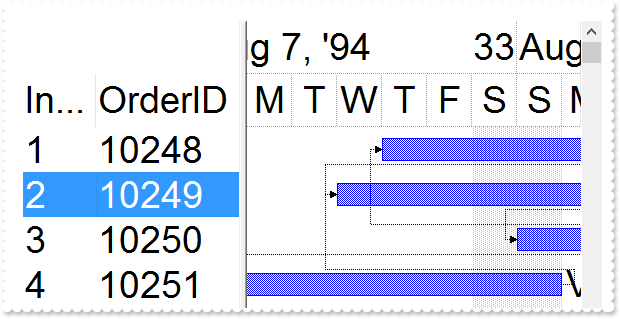
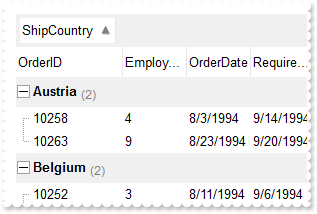
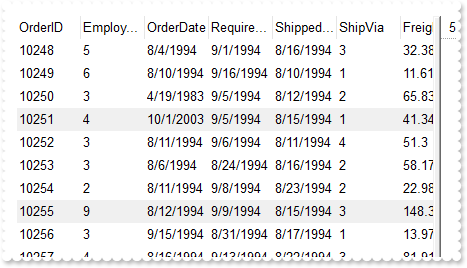
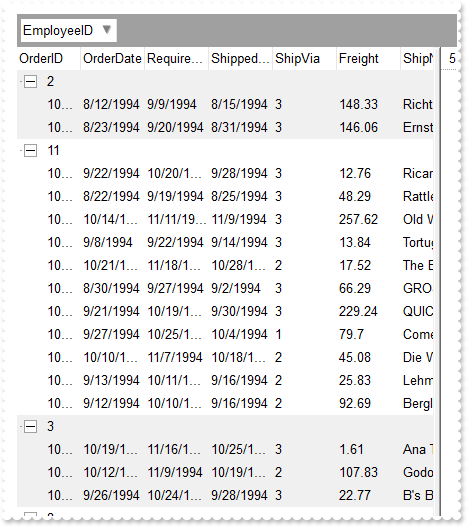
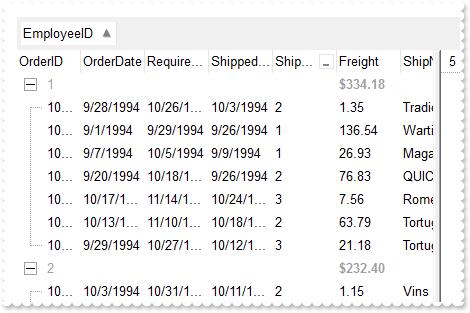
How can I display the total/sum/aggregate in the same column, when the user groups by a column
/*begin event AddColumn(oleobject  Column) - Fired after a new column has been added.*/
/*
	oG2antt = ole_1.Object
*/
/*end event AddColumn*/

/*begin event AddGroupItem(long  Item) - Occurs after a new Group Item has been inserted to Items collection.*/
/*
	OleObject var_Items
	oG2antt = ole_1.Object
	var_Items = oG2antt.Items
		var_Items.ItemDivider(Item,-1)
		var_Items.ItemBackColor(Item,oG2antt.BackColorSortBar)
		var_Items.ItemHeight(Item,oG2antt.HeaderHeight)
		var_Items.CellMerge(Item,0,"1,2,3,4,5,7,8,9,10,11,12")
		var_Items.CellValue(Item,13,"count(current,rec,1)")
		var_Items.CellValueFormat(Item,13,5 /*exTotalField | exHTML*/)
		var_Items.CellValue(Item,0,var_Items.CellCaption(Item,var_Items.GroupItem(Item)))
		var_Items.FormatCell(Item,0,"`<b>` + value + `</b> <font ;7><off 3><fgcolor=808080>(` + %13 +  `)`")
		var_Items.CellValue(Item,6,"sum(current,all,dbl(%6))")
		var_Items.CellValueFormat(Item,6,5 /*exTotalField | exHTML*/)
		var_Items.CellForeColor(Item,6,RGB(102,102,102))
*/
/*end event AddGroupItem*/

/*begin event Change(long  Item, long  ColIndex, any  NewValue) - Occurs when the user changes the cell's content.*/
/*
	oG2antt = ole_1.Object
	oG2antt.Refresh()
*/
/*end event Change*/

OleObject oG2antt,rs,var_Column,var_Column1,var_Columns,var_Items
any hL

oG2antt = ole_1.Object
oG2antt.BeginUpdate()
oG2antt.LinesAtRoot = 5
oG2antt.Indent = 12
oG2antt.ColumnAutoResize = false
oG2antt.ScrollBySingleLine = true
oG2antt.BackColorSortBar = RGB(240,240,240)
oG2antt.AutoDrag = 16
rs = CREATE OLEObject
rs.ConnectToNewObject("ADOR.Recordset")
	rs.Open("Orders","Provider=Microsoft.ACE.OLEDB.12.0;Data Source=C:\Program Files\Exontrol\ExG2antt\Sample\Access\misc.accdb",3,3)
oG2antt.DataSource = rs
oG2antt.SingleSort = false
oG2antt.SortBarVisible = true
oG2antt.AllowGroupBy = true
oG2antt.HeaderHeight = 24
var_Columns = oG2antt.Columns
	var_Columns.Add("Count").Visible = false
	var_Column = var_Columns.Item("Freight")
		var_Column.Def(4,oG2antt.BackColorSortBar)
		var_Column.Def(7,var_Column.Def(4))
		var_Column.Def(49,4)
		var_Column.Def(48,4)
		var_Column.HeaderBold = true
		var_Column.AllowGroupBy = false
		var_Column.FormatColumn = "value format ``"
		var_Column.Alignment = 2
	var_Column1 = var_Columns.Item(0)
		var_Column1.AllowGroupBy = false
		var_Column1.Def(17,1)
	var_Columns.Item("ShipCountry").SortOrder = 1
oG2antt.ScrollBySingleLine = false
var_Items = oG2antt.Items
	var_Items.LockedItemCount(2,1)
	hL = var_Items.LockedItem(2,0)
	var_Items.ItemHeight(hL,24)
	var_Items.ItemBold(hL,true)
	var_Items.ItemBackColor(hL,oG2antt.BackColorSortBar)
	var_Items.CellValue(hL,6,"sum(all,rec,dbl(%6))")
	var_Items.CellValueFormat(hL,6,5 /*exTotalField | exHTML*/)
	var_Items.CellHAlignment(hL,6,2)
	var_Items.FormatCell(hL,6,"value format ``")
oG2antt.EndUpdate()
|
|
2191
|
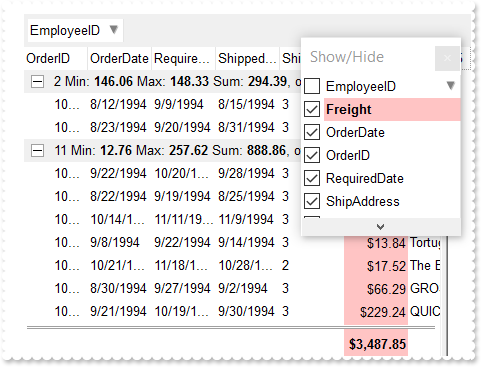
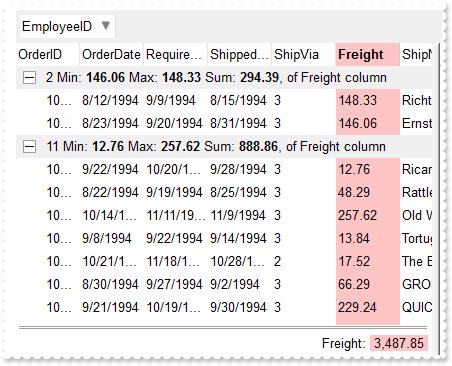
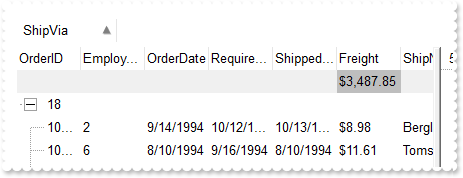
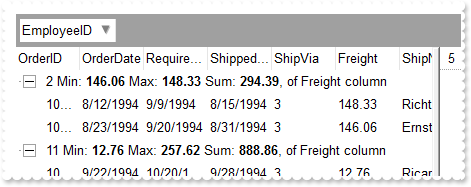
How do I add a total field locked at the bottom of the control
/*begin event AddGroupItem(long  Item) - Occurs after a new Group Item has been inserted to Items collection.*/
/*
	OleObject var_Items
	oG2antt = ole_1.Object
	var_Items = oG2antt.Items
		var_Items.ItemDividerLine(Item,0)
		var_Items.FormatCell(Item,var_Items.GroupItem(Item),"value + ` Min: <b>` + %13 + `</b> Max: <b>` + %14 + `</b> Sum: <b>` + %15 + `</b>, of Freight column`")
		var_Items.CellValue(Item,"Min","min(current,all,dbl(%6))")
		var_Items.CellValueFormat(Item,"Min",4)
		var_Items.CellValue(Item,"Max","max(current,all,dbl(%6))")
		var_Items.CellValueFormat(Item,"Max",4)
		var_Items.CellValue(Item,"Sum","sum(current,all,dbl(%6))")
		var_Items.CellValueFormat(Item,"Sum",4)
		var_Items.ItemBackColor(Item,RGB(240,240,240))
*/
/*end event AddGroupItem*/

/*begin event Change(long  Item, long  ColIndex, any  NewValue) - Occurs when the user changes the cell's content.*/
/*
	oG2antt = ole_1.Object
	oG2antt.Refresh()
*/
/*end event Change*/

OleObject oG2antt,rs,var_Column,var_Column1,var_Column2,var_Columns,var_Items
any hL

oG2antt = ole_1.Object
oG2antt.BeginUpdate()
oG2antt.HasLines = 0
oG2antt.Description(26,"Show/Hide")
oG2antt.ColumnsFloatBarSortOrder = 1
oG2antt.ColumnsFloatBarVisible = 2
oG2antt.ColumnAutoResize = false
oG2antt.BackColorSortBar = RGB(240,240,240)
rs = CREATE OLEObject
rs.ConnectToNewObject("ADOR.Recordset")
	rs.Open("Orders","Provider=Microsoft.ACE.OLEDB.12.0;Data Source=C:\Program Files\Exontrol\ExG2antt\Sample\Access\misc.accdb",3,3)
oG2antt.DataSource = rs
oG2antt.SingleSort = false
oG2antt.SortBarVisible = true
oG2antt.AllowGroupBy = true
oG2antt.SortBarCaption = "Drag a <b>column</b> header here to group by that column."
var_Columns = oG2antt.Columns
	var_Column = var_Columns.Add("Min")
		var_Column.Visible = false
		var_Column.AllowDragging = false
	var_Column = var_Columns.Add("Max")
		var_Column.Visible = false
		var_Column.Visible = false
		var_Column.AllowDragging = false
	var_Column1 = var_Columns.Add("Sum")
		var_Column1.Visible = false
		var_Column1.Visible = false
		var_Column1.AllowDragging = false
var_Column2 = oG2antt.Columns.Item("Freight")
	var_Column2.FormatColumn = "currency(value)"
	var_Column2.Def(4,12895487)
	var_Column2.Def(7,var_Column2.Def(4))
	var_Column2.HeaderBold = true
	var_Column2.AllowGroupBy = false
	var_Column2.Alignment = 2
oG2antt.ScrollBySingleLine = false
var_Items = oG2antt.Items
	var_Items.LockedItemCount(2,2)
	hL = var_Items.LockedItem(2,0)
	var_Items.ItemDivider(hL,0)
	var_Items.ItemHeight(hL,3)
	var_Items.ItemDividerLineAlignment(hL,2)
	var_Items.ItemDividerLine(hL,2)
	hL = var_Items.LockedItem(2,1)
	var_Items.CellValue(hL,6,"sum(all,rec,dbl(%6))")
	var_Items.CellValueFormat(hL,6,4)
	var_Items.ItemHeight(hL,24)
	var_Items.ItemBold(hL,true)
oG2antt.Columns.Item("EmployeeID").SortOrder = true
oG2antt.EndUpdate()
|
|
2190
|
How can I add a total field, when I use grouping
/*begin event AddGroupItem(long  Item) - Occurs after a new Group Item has been inserted to Items collection.*/
/*
	OleObject var_Items
	oG2antt = ole_1.Object
	var_Items = oG2antt.Items
		var_Items.ItemDividerLine(Item,0)
		var_Items.FormatCell(Item,var_Items.GroupItem(Item),"value + ` Min: <b>` + %13 + `</b> Max: <b>` + %14 + `</b> Sum: <b>` + %15 + `</b>, of Freight column`")
		var_Items.CellValue(Item,"Min","min(current,all,dbl(%6))")
		var_Items.CellValueFormat(Item,"Min",4)
		var_Items.CellValue(Item,"Max","max(current,all,dbl(%6))")
		var_Items.CellValueFormat(Item,"Max",4)
		var_Items.CellValue(Item,"Sum","sum(current,all,dbl(%6))")
		var_Items.CellValueFormat(Item,"Sum",4)
		var_Items.ItemBackColor(Item,RGB(240,240,240))
*/
/*end event AddGroupItem*/

/*begin event Change(long  Item, long  ColIndex, any  NewValue) - Occurs when the user changes the cell's content.*/
/*
	oG2antt = ole_1.Object
	oG2antt.Refresh()
*/
/*end event Change*/

OleObject oG2antt,rs,var_Column,var_Columns,var_Items
any hL

oG2antt = ole_1.Object
oG2antt.BeginUpdate()
oG2antt.HasLines = 0
oG2antt.ColumnAutoResize = false
oG2antt.BackColorSortBar = RGB(240,240,240)
rs = CREATE OLEObject
rs.ConnectToNewObject("ADOR.Recordset")
	rs.Open("Orders","Provider=Microsoft.ACE.OLEDB.12.0;Data Source=C:\Program Files\Exontrol\ExG2antt\Sample\Access\misc.accdb",3,3)
oG2antt.DataSource = rs
oG2antt.SingleSort = false
oG2antt.SortBarVisible = true
oG2antt.AllowGroupBy = true
oG2antt.Columns.Item(1).SortOrder = true
var_Columns = oG2antt.Columns
	var_Columns.Add("Min").Visible = false
	var_Columns.Add("Max").Visible = false
	var_Columns.Add("Sum").Visible = false
var_Column = oG2antt.Columns.Item("Freight")
	var_Column.Def(4,12895487)
	var_Column.Def(7,var_Column.Def(4))
	var_Column.HeaderBold = true
	var_Column.AllowGroupBy = false
oG2antt.ScrollBySingleLine = false
var_Items = oG2antt.Items
	var_Items.LockedItemCount(2,1)
	hL = var_Items.LockedItem(2,0)
	var_Items.ItemDivider(hL,0)
	var_Items.ItemHeight(hL,24)
	var_Items.ItemDividerLineAlignment(hL,2)
	var_Items.ItemDividerLine(hL,2)
	var_Items.CellValue(hL,0,"sum(all,rec,dbl(%6))")
	var_Items.CellValueFormat(hL,0,5 /*exTotalField | exHTML*/)
	var_Items.CellHAlignment(hL,0,2)
	var_Items.FormatCell(hL,0,"'Freight: <bgcolor=FFC4C4> '+(value format ``) + ` `")
oG2antt.EndUpdate()
|
|
2189
|
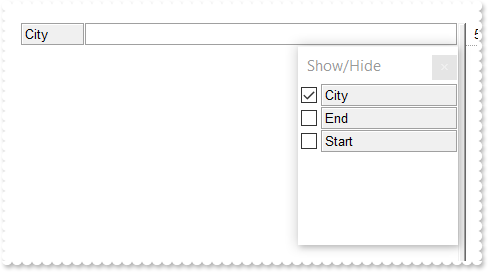
How do I use the ColumnsFloatBarVisible on exColumnsFloatBarVisibleIncludeCheckColumns
OleObject oG2antt,var_Columns

oG2antt = ole_1.Object
oG2antt.BeginUpdate()
oG2antt.ColumnAutoResize = false
oG2antt.HeaderAppearance = 4
var_Columns = oG2antt.Columns
	var_Columns.Add("City")
	var_Columns.Add("Start").Visible = false
	var_Columns.Add("End").Visible = false
oG2antt.Description(26,"Show/Hide")
oG2antt.ColumnsFloatBarSortOrder = 1
oG2antt.ColumnsFloatBarVisible = 2
oG2antt.EndUpdate()
|
|
2188
|
The BackColorAlternate displays each second row with a different background color. The question I have it is possible to apply a different background color for 3rd, 4th, row, and so on
/*begin event LayoutChanged() - Occurs when column's position or column's size is changed.*/
/*
	oG2antt = ole_1.Object
	oG2antt.Refresh()
*/
/*end event LayoutChanged*/

/*begin event Sort() - Fired when the control sorts a column.*/
/*
	oG2antt = ole_1.Object
	oG2antt.Refresh()
*/
/*end event Sort*/

OleObject oG2antt,rs,var_Column

oG2antt = ole_1.Object
oG2antt.BeginUpdate()
oG2antt.HasLines = 0
oG2antt.ColumnAutoResize = false
rs = CREATE OLEObject
rs.ConnectToNewObject("ADOR.Recordset")
	rs.Open("Orders","Provider=Microsoft.ACE.OLEDB.12.0;Data Source=C:\Program Files\Exontrol\ExG2antt\Sample\Access\misc.accdb",3,3)
oG2antt.DataSource = rs
var_Column = oG2antt.Columns.Add("Position")
	var_Column.FormatColumn = "1 apos ''"
	var_Column.Visible = false
oG2antt.ConditionalFormats.Add("(%C13 mod 4) = 0").BackColor = RGB(240,240,240)
oG2antt.EndUpdate()
|
|
2187
|
The BackColorAlternate looks fine for flat tables, but how about using it when displaying a hierarchy/tree, like grouping rows. The sample alternate colors for each group found
/*begin event LayoutChanged() - Occurs when column's position or column's size is changed.*/
/*
	oG2antt = ole_1.Object
	oG2antt.Refresh()
*/
/*end event LayoutChanged*/

OleObject oG2antt,rs,var_Column

oG2antt = ole_1.Object
oG2antt.BeginUpdate()
oG2antt.HasLines = 0
oG2antt.ColumnAutoResize = false
rs = CREATE OLEObject
rs.ConnectToNewObject("ADOR.Recordset")
	rs.Open("Orders","Provider=Microsoft.ACE.OLEDB.12.0;Data Source=C:\Program Files\Exontrol\ExG2antt\Sample\Access\misc.accdb",3,3)
oG2antt.DataSource = rs
oG2antt.SingleSort = false
oG2antt.SortBarVisible = true
oG2antt.AllowGroupBy = true
oG2antt.Columns.Item(1).SortOrder = true
var_Column = oG2antt.Columns.Add("Position")
	var_Column.FormatColumn = "(0:= (1 rpos '')) left ( ( 1:= ( =:0 lfind `.` ) ) != -1 ? =:1 : len(=:0))"
	var_Column.Visible = false
oG2antt.ConditionalFormats.Add("(%C13 mod 2) != 0").BackColor = RGB(240,240,240)
oG2antt.EndUpdate()
|
|
2186
|
I need to display sub-totals in the grouping items. Is there any solution on this
/*begin event AddGroupItem(long  Item) - Occurs after a new Group Item has been inserted to Items collection.*/
/*
	OleObject var_Items
	oG2antt = ole_1.Object
	var_Items = oG2antt.Items
		var_Items.ItemDivider(Item,-1)
		var_Items.EnableItem(Item,false)
		var_Items.CellValueFormat(Item,oG2antt.TreeColumnIndex,1)
		var_Items.FormatCell(Item,oG2antt.TreeColumnIndex,"%1")
		var_Items.CellValueFormat(Item,"Freight",5 /*exTotalField | exHTML*/)
		var_Items.CellValue(Item,"Freight","sum(current,dir,%6)")
		var_Items.FormatCell(Item,"Freight","`<b>` + currency(value)")
*/
/*end event AddGroupItem*/

OleObject oG2antt,rs

oG2antt = ole_1.Object
oG2antt.BeginUpdate()
oG2antt.SelBackMode = 1
oG2antt.BackColorSortBar = RGB(240,240,240)
oG2antt.ColumnAutoResize = false
rs = CREATE OLEObject
rs.ConnectToNewObject("ADOR.Recordset")
	rs.Open("Orders","Provider=Microsoft.ACE.OLEDB.12.0;Data Source=C:\Program Files\Exontrol\ExG2antt\Sample\Access\misc.accdb",3,3)
oG2antt.DataSource = rs
oG2antt.SortBarVisible = true
oG2antt.SortBarCaption = "Drag a <b>column</b> header here to group by that column."
oG2antt.AllowGroupBy = true
oG2antt.Columns.Item(1).SortOrder = 1
oG2antt.LinesAtRoot = 5
oG2antt.Columns.Item("ShipVia").DisplayFilterButton = true
oG2antt.EndUpdate()
|
|
2185
|
I use a subtotal in exTop-Item, after grouping the item shows 0. What is the solution
OleObject oG2antt,rs,var_Items
any h

oG2antt = ole_1.Object
oG2antt.BeginUpdate()
oG2antt.ColumnAutoResize = false
rs = CREATE OLEObject
rs.ConnectToNewObject("ADOR.Recordset")
	rs.Open("Orders","Provider=Microsoft.ACE.OLEDB.12.0;Data Source=C:\Program Files\Exontrol\ExG2antt\Sample\Access\misc.accdb",3,3)
oG2antt.DataSource = rs
oG2antt.SingleSort = false
oG2antt.AllowGroupBy = true
oG2antt.SortBarVisible = true
oG2antt.BackColorSortBar = oG2antt.BackColor
oG2antt.Columns.Item(5).SortOrder = 1
oG2antt.Columns.Item(6).FormatColumn = "currency(value)"
var_Items = oG2antt.Items
	var_Items.LockedItemCount(0,1)
	h = var_Items.LockedItem(0,0)
	var_Items.ItemBackColor(h,RGB(240,240,240))
	var_Items.CellBackColor(h,6,RGB(190,190,190))
	var_Items.CellValue(h,6,"sum(all,rec,%6)")
	var_Items.CellValueFormat(h,6,4)
oG2antt.Refresh()
oG2antt.EndUpdate()
|
|
2184
|
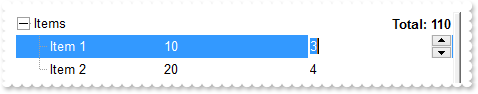
How can I add multiple values/columns on the same line/item/row
/*begin event Change(long  Item, long  ColIndex, any  NewValue) - Occurs when the user changes the cell's content.*/
/*
	oG2antt = ole_1.Object
	oG2antt.Refresh()
*/
/*end event Change*/

OleObject oG2antt,var_Columns,var_Items
any h,h1

oG2antt = ole_1.Object
oG2antt.BeginUpdate()
oG2antt.SortOnClick = 0
oG2antt.LinesAtRoot = 5
oG2antt.Indent = 13
oG2antt.HeaderVisible = false
oG2antt.LinesAtRoot = -1
var_Columns = oG2antt.Columns
	var_Columns.Add("Items")
	var_Columns.Add("Quantity").Editor.EditType = 4
	var_Columns.Add("Value").Editor.EditType = 4
var_Items = oG2antt.Items
	h = var_Items.AddItem("Items")
	var_Items.CellValue(h,2,"sum(current,dir,dbl(%1)*dbl(%2))")
	var_Items.CellValueFormat(h,2,4)
	var_Items.FormatCell(h,2,"`Total: `+ value")
	var_Items.CellHAlignment(h,2,2)
	var_Items.CellBold(h,2,true)
	var_Items.CellEditorVisible(h,2,false)
	var_Items.CellEditorVisible(h,1,false)
	h1 = var_Items.InsertItem(h,,"Item 1")
	var_Items.CellValue(h1,1,10)
	var_Items.CellValue(h1,2,3)
	h1 = var_Items.InsertItem(h,,"Item 2")
	var_Items.CellValue(h1,1,20)
	var_Items.CellValue(h1,2,4)
	var_Items.ExpandItem(h,true)
oG2antt.EndUpdate()
|
|
2183
|
Is it possible, to add more aggregate functions to grouping header
/*begin event AddGroupItem(long  Item) - Occurs after a new Group Item has been inserted to Items collection.*/
/*
	OleObject var_Items
	oG2antt = ole_1.Object
	var_Items = oG2antt.Items
		var_Items.FormatCell(Item,var_Items.GroupItem(Item),"value + ` Min: <b>` + %13 + `</b> Max: <b>` + %14 + `</b> Sum: <b>` + %15 + `</b>, of Freight column`")
		var_Items.CellValue(Item,"Min","min(current,all,dbl(%6))")
		var_Items.CellValueFormat(Item,"Min",4)
		var_Items.CellValue(Item,"Max","max(current,all,dbl(%6))")
		var_Items.CellValueFormat(Item,"Max",4)
		var_Items.CellValue(Item,"Sum","sum(current,all,dbl(%6))")
		var_Items.CellValueFormat(Item,"Sum",4)
*/
/*end event AddGroupItem*/

/*begin event Change(long  Item, long  ColIndex, any  NewValue) - Occurs when the user changes the cell's content.*/
/*
	oG2antt = ole_1.Object
	oG2antt.Refresh()
*/
/*end event Change*/

OleObject oG2antt,rs,var_Columns

oG2antt = ole_1.Object
oG2antt.BeginUpdate()
oG2antt.HasLines = 0
oG2antt.ColumnAutoResize = false
rs = CREATE OLEObject
rs.ConnectToNewObject("ADOR.Recordset")
	rs.Open("Orders","Provider=Microsoft.ACE.OLEDB.12.0;Data Source=C:\Program Files\Exontrol\ExG2antt\Sample\Access\misc.accdb",3,3)
oG2antt.DataSource = rs
oG2antt.SingleSort = false
oG2antt.SortBarVisible = true
oG2antt.AllowGroupBy = true
oG2antt.Columns.Item(1).SortOrder = true
var_Columns = oG2antt.Columns
	var_Columns.Add("Min").Visible = false
	var_Columns.Add("Max").Visible = false
	var_Columns.Add("Sum").Visible = false
oG2antt.EndUpdate()
|
|
2182
|
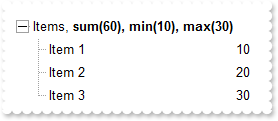
Is it possible to display more aggregate functions to a single cell (method 2)
/*begin event Change(long  Item, long  ColIndex, any  NewValue) - Occurs when the user changes the cell's content.*/
/*
	oG2antt = ole_1.Object
	oG2antt.Refresh()
*/
/*end event Change*/

OleObject oG2antt,var_Columns,var_Items
any h

oG2antt = ole_1.Object
oG2antt.BeginUpdate()
oG2antt.SortOnClick = 0
oG2antt.LinesAtRoot = 5
oG2antt.Indent = 13
oG2antt.HeaderVisible = false
oG2antt.LinesAtRoot = -1
var_Columns = oG2antt.Columns
	var_Columns.Add("Items")
	var_Columns.Add("Quantity").Editor.EditType = 4
	var_Columns.Add("Sum").Visible = false
	var_Columns.Add("Min").Visible = false
	var_Columns.Add("Max").Visible = false
var_Items = oG2antt.Items
	h = var_Items.AddItem("Items")
	var_Items.CellMerge(h,0,1)
	var_Items.FormatCell(h,0,"`Items, <b>sum(` + %2 + `), min(` + %3 + `), max(` + %4 + `)</b>`")
	var_Items.CellValueFormat(h,0,1)
	var_Items.CellValue(h,2,"sum(current,dir,dbl(%1))")
	var_Items.CellValueFormat(h,2,4)
	var_Items.CellValue(h,3,"min(current,dir,dbl(%1))")
	var_Items.CellValueFormat(h,3,4)
	var_Items.CellValue(h,4,"max(current,dir,dbl(%1))")
	var_Items.CellValueFormat(h,4,4)
	var_Items.CellValue(var_Items.InsertItem(h,,"Item 1"),1,10)
	var_Items.CellValue(var_Items.InsertItem(h,,"Item 2"),1,20)
	var_Items.CellValue(var_Items.InsertItem(h,,"Item 3"),1,30)
	var_Items.ExpandItem(h,true)
oG2antt.EndUpdate()
|
|
2181
|
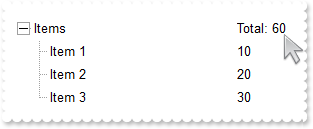
How can I use the current in the aggregate/total field
/*begin event Change(long  Item, long  ColIndex, any  NewValue) - Occurs when the user changes the cell's content.*/
/*
	oG2antt = ole_1.Object
	oG2antt.Refresh()
*/
/*end event Change*/

OleObject oG2antt,var_Columns,var_Items
any h

oG2antt = ole_1.Object
oG2antt.BeginUpdate()
oG2antt.SortOnClick = 0
oG2antt.LinesAtRoot = 5
oG2antt.Indent = 13
oG2antt.HeaderVisible = false
oG2antt.LinesAtRoot = -1
var_Columns = oG2antt.Columns
	var_Columns.Add("Items")
	var_Columns.Add("Quantity").Editor.EditType = 4
var_Items = oG2antt.Items
	h = var_Items.AddItem("Items")
	var_Items.CellValue(h,1,"sum(current,dir,dbl(%1))")
	var_Items.CellValueFormat(h,1,4)
	var_Items.FormatCell(h,1,"`Total: `+ value")
	var_Items.CellValue(var_Items.InsertItem(h,,"Item 1"),1,10)
	var_Items.CellValue(var_Items.InsertItem(h,,"Item 2"),1,20)
	var_Items.CellValue(var_Items.InsertItem(h,,"Item 3"),1,30)
	var_Items.ExpandItem(h,true)
oG2antt.EndUpdate()
|
|
2180
|
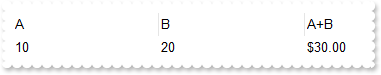
The CellValue/CellCaption property gets the result of a computed/total field with text formatting. Is it possible to get that value without text formatting
OleObject oG2antt,var_Items
any h

oG2antt = ole_1.Object
oG2antt.BeginUpdate()
oG2antt.Columns.Add("A").Editor.EditType = 4
oG2antt.Columns.Add("B").Editor.EditType = 4
oG2antt.Columns.Add("A+B")
var_Items = oG2antt.Items
	h = var_Items.AddItem(10)
	var_Items.CellValue(h,1,20)
	var_Items.CellValueFormat(h,2,2)
	var_Items.CellValue(h,2,"currency(dbl(%0)+dbl(%1))")
	MessageBox("Information",string( "CellCaption returns " ))
	MessageBox("Information",string( var_Items.CellCaption(h,2) ))
	MessageBox("Information",string( "CellValue returns " ))
	MessageBox("Information",string( String(var_Items.CellValue(h,2)) ))
	MessageBox("Information",string( "ComputeValue returns " ))
	MessageBox("Information",string( String(var_Items.ComputeValue("dbl(%0)+dbl(%1)",h,0,var_Items.CellValueFormat(h,2))) ))
oG2antt.EndUpdate()
|
|
2179
|
Can I get the result of a specified formula as your control does using the ComputedField property
OleObject oG2antt,var_Items
any h

oG2antt = ole_1.Object
oG2antt.BeginUpdate()
oG2antt.Columns.Add("A")
oG2antt.Columns.Add("B")
var_Items = oG2antt.Items
	h = var_Items.AddItem(10)
	var_Items.CellValue(h,1,20)
	MessageBox("Information",string( "A+B is " ))
	MessageBox("Information",string( String(var_Items.ComputeValue("dbl(%0)+dbl(%1)",h,0,2)) ))
oG2antt.EndUpdate()
|
|
2178
|
Is it possible to get the text without HTML formatting
OleObject oG2antt,var_Items
any h

oG2antt = ole_1.Object
oG2antt.BeginUpdate()
oG2antt.Columns.Add("")
var_Items = oG2antt.Items
	h = var_Items.AddItem("<b>bold</b>")
	MessageBox("Information",string( String(var_Items.ComputeValue(var_Items.CellValue(h,0),h,0,1)) ))
oG2antt.EndUpdate()
|
|
2177
|
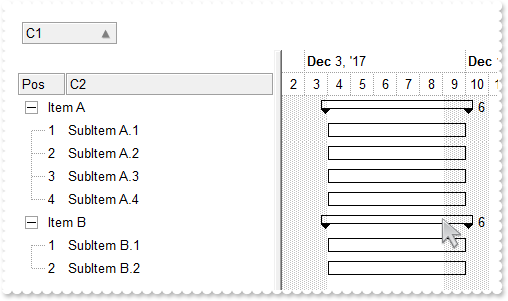
Transparent/Border SummaryBar
/*begin event AddGroupItem(long  Item) - Occurs after a new Group Item has been inserted to Items collection.*/
/*
	OleObject var_Items
	oG2antt = ole_1.Object
	var_Items = oG2antt.Items
		var_Items.ItemDividerLine(Item,0)
		var_Items.AddBar(Item,"Summary",2017-12-02,2017-12-02)
		var_Items.DefineSummaryBars(Item,"",-3,"")
*/
/*end event AddGroupItem*/

/*begin event AddItem(long  Item) - Occurs after a new Item has been inserted to Items collection.*/
/*
	oG2antt = ole_1.Object
	oG2antt.Items.AddBar(Item,"Task",2017-12-04,2017-12-10)
*/
/*end event AddItem*/

OleObject oG2antt,var_Bar,var_Bar1,var_Chart,var_Column,var_Columns,var_Items

oG2antt = ole_1.Object
oG2antt.BeginUpdate()
oG2antt.VisualAppearance.Add(1,"gBFLBCJwBAEHhEJAAEhABHEGACAADACAxRDgMQBQKAAzQFAYbBuGCGAAGIYBTgmFgAQhFcZQSKUOQTDKMIziaQJiYLBIaRgEUTRXASCQxDBKQBSeKkRRtDaOYDnGQYDiCIouQLEIxDKItBSJCKURJkAZZHjeToSR5PMb0dKdAw5I6raShEaaIiqJIXP7Fc7QSA0EgTBIFajgOpQAb+bptW7FVDULTMQS5FCZKasOA7FgOZ4DWjUVpwTZ1Q4LC65bjuaraawKbYbXrFYJQSA8EwjNjDcLuKqcKpvDJsSJIFKxOB2KYtBLMLbzLR5apjLZ0QLSOKRDoMEgRDYGdKjLScGrGao8ABtcBlAZJRjoOo5DJgeCQapUQhNczGQzQSIiBOJZAFSQwRHcJhGh2BZvngMIeA8H4TksA5ylgZBeg8X4GmGX4nniPazneQ5VnKdp9H8P4vD+X57nMRofmgBZ4FgIAoBWdoBGAGAeAgfxfjgNZ1DqWxEA0ASAgA==")
var_Chart = oG2antt.Chart
	var_Chart.LevelCount = 2
	var_Chart.FirstVisibleDate = 2017-12-02
	var_Chart.PaneWidth(false,256)
	var_Bar = var_Chart.Bars.Item("Summary")
		var_Bar.Color = 16777216 /*0x1000000*/
		var_Bar.Def(3,"<%=%513%>")
		var_Bar.Def(4,18)
		var_Bar.Def(58,8)
	var_Bar1 = var_Chart.Bars.Item("Task")
		var_Bar1.Pattern = 32
		var_Bar1.Color = RGB(0,0,0)
var_Columns = oG2antt.Columns
	var_Columns.Add("C1")
	var_Columns.Add("C2")
	var_Column = var_Columns.Add("Pos")
		var_Column.FormatColumn = "1 pos ``"
		var_Column.AllowGroupBy = false
		var_Column.Position = 0
		var_Column.Width = 48
		var_Column.AllowSizing = false
oG2antt.SortBarVisible = true
oG2antt.AllowGroupBy = true
oG2antt.BackColorSortBar = oG2antt.BackColor
oG2antt.HeaderAppearance = 4
var_Items = oG2antt.Items
	var_Items.CellValue(var_Items.AddItem("Item A"),1,"SubItem A.1")
	var_Items.CellValue(var_Items.AddItem("Item A"),1,"SubItem A.2")
	var_Items.CellValue(var_Items.AddItem("Item A"),1,"SubItem A.3")
	var_Items.CellValue(var_Items.AddItem("Item A"),1,"SubItem A.4")
	var_Items.CellValue(var_Items.AddItem("Item B"),1,"SubItem B.1")
	var_Items.CellValue(var_Items.AddItem("Item B"),1,"SubItem B.2")
oG2antt.Columns.Item(0).SortOrder = 1
oG2antt.EndUpdate()
|
|
2176
|
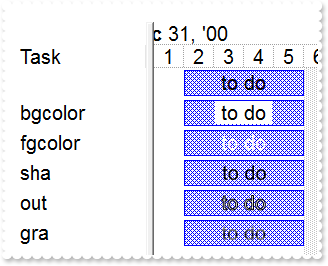
The bar's caption is very difficult to read if any pattern than exPatternSolid is used. Is there any way of displaying the bar's caption (except for displaying the caption outside the bar)
OleObject oG2antt,var_Bar,var_Chart,var_Items
any h

oG2antt = ole_1.Object
oG2antt.BeginUpdate()
oG2antt.Font.Size = 12
oG2antt.DefaultItemHeight = 24
oG2antt.Columns.Add("Task")
var_Chart = oG2antt.Chart
	var_Chart.LevelCount = 2
	var_Chart.FirstVisibleDate = 2001-01-01
	var_Bar = var_Chart.Bars.Item("Task")
		var_Bar.Height = 21
		var_Bar.Pattern = 7
	var_Chart.PaneWidth(false,128)
	var_Chart.UnitWidth = 24
var_Items = oG2antt.Items
	h = var_Items.AddItem("")
	var_Items.AddBar(h,"Task",2001-01-02,2001-01-06,"")
	var_Items.ItemBar(h,"",3,"to do")
	h = var_Items.AddItem("bgcolor")
	var_Items.AddBar(h,"Task",2001-01-02,2001-01-06,"")
	var_Items.ItemBar(h,"",3,"<bgcolor=FFFFFF> to do </bgcolor>")
	h = var_Items.AddItem("fgcolor")
	var_Items.AddBar(h,"Task",2001-01-02,2001-01-06,"")
	var_Items.ItemBar(h,"",3,"<fgcolor=FFFFFF> to do </fgcolor>")
	h = var_Items.AddItem("sha")
	var_Items.AddBar(h,"Task",2001-01-02,2001-01-06,"")
	var_Items.ItemBar(h,"",3,"<sha FFFFFF;2;2> to do </sha>")
	h = var_Items.AddItem("out")
	var_Items.AddBar(h,"Task",2001-01-02,2001-01-06,"")
	var_Items.ItemBar(h,"",3,"<out 000000><fgcolor=FFFFFF>to do</fgcolor></out></font>")
	h = var_Items.AddItem("gra")
	var_Items.AddBar(h,"Task",2001-01-02,2001-01-06,"")
	var_Items.ItemBar(h,"",3,"<fgcolor FFFFFF><gra 000000;1;1>to do</fgcolor>")
oG2antt.EndUpdate()
|
|
2175
|
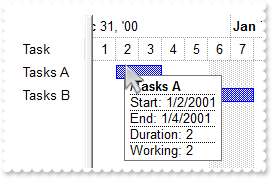
How can I change the position of the bar's tooltip
/*begin event ToolTip(long  Item, long  ColIndex, boolean  Visible, long  X, long  Y, long  CX, long  CY) - Fired when the control prepares the object's tooltip.*/
/*
	oG2antt = ole_1.Object
	MessageBox("Information",string( "ToolTip" ))
	MessageBox("Information",string( String(Item) ))
	MessageBox("Information",string( String(ColIndex) ))
	MessageBox("Information",string( String(Visible) ))
	MessageBox("Information",string( String(X) ))
	MessageBox("Information",string( String(Y) ))
	MessageBox("Information",string( String(CX) ))
	MessageBox("Information",string( String(CY) ))
	X = oG2antt.FormatABC("value + 8",X)
	Y = oG2antt.FormatABC("value - 8",Y)
*/
/*end event ToolTip*/

OleObject oG2antt,var_Chart,var_Items

oG2antt = ole_1.Object
oG2antt.BeginUpdate()
oG2antt.Columns.Add("Task")
var_Chart = oG2antt.Chart
	var_Chart.PaneWidth(false,64)
	var_Chart.FirstVisibleDate = 2001-01-01
	var_Chart.Bars.Item("Task").Def(6,"<b><%=%9 + '/' + %C0%></b><br><upline><dotline>Start: <%=%1%><br>End: <%=%2%><br>Duration: <%=(%2-%1)%><br>Working: <%=%258%>")
	var_Chart.LevelCount = 2
var_Items = oG2antt.Items
	var_Items.AddBar(var_Items.AddItem("Tasks A"),"Task",2001-01-02,2001-01-04)
	var_Items.AddBar(var_Items.AddItem("Tasks B"),"Task",2001-01-03,2001-01-08)
oG2antt.EndUpdate()
|
|
2174
|
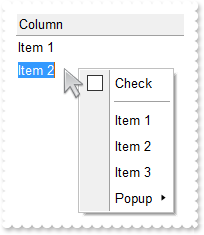
How can I replace the cell's context menu ( while edit mode is running )
/*begin event RClick() - Fired when right mouse button is clicked*/
/*
	OleObject var_ExContextMenu
	oG2antt = ole_1.Object
	MessageBox("Information",string( "Edit Mode: " ))
	MessageBox("Information",string( String(oG2antt.Editing) ))
	var_ExContextMenu = CREATE OLEObject
	var_ExContextMenu.ConnectToNewObject("Exontrol.ContextMenu")
		var_ExContextMenu.Items.ToString = "Check[chk],[sep],Item 1,Item 2,Item 3,Popup(A,B,C)"
		MessageBox("Information",string( String(var_ExContextMenu.Select()) ))
*/
/*end event RClick*/

OleObject oG2antt,var_Editor,var_Items

oG2antt = ole_1.Object
oG2antt.BeginUpdate()
oG2antt.HeaderAppearance = 1
var_Editor = oG2antt.Columns.Add("Column").Editor
	var_Editor.EditType = 1
	var_Editor.Option(202,false)
var_Items = oG2antt.Items
	var_Items.AddItem("Item 1")
	var_Items.AddItem("Item 2")
oG2antt.EndUpdate()
|
|
2173
|
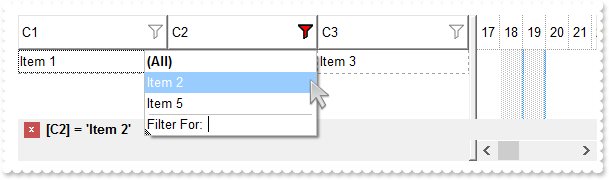
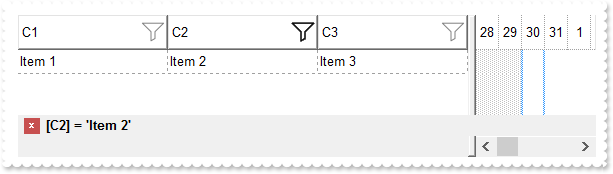
Is it possible to highlight the column's header once a filter is applied (sample 2)
OleObject oG2antt,var_Appearance,var_Column,var_Columns,var_Items
any h

oG2antt = ole_1.Object
oG2antt.BeginUpdate()
var_Appearance = oG2antt.VisualAppearance
	var_Appearance.Add(1,"gBFLBCJwBAEHhEJAAEhABO8GACAADACAxRDgMQBQKAAzQFAYbBuGCGAAGIYBTgmFgAQhFcZQSKUOQTDKNYykCIRSDUJYkSZEIyjBI8ExXFqNACkGKwQgmNYDSBMcbwSAsXRYFocJ5gOT6AjKBA2UclEZpajiTY3ABUEgUS5oOBIACqariaQJAAiCRQGiYZyHKaRSwPBKFYDIIjbJheTIDChNVxUcDENQjJqLBIDRzbarye59YBfeBXdgmA4LQbDMRwNgMMQTDqKYbkOQZHbeGKAWTMEZzJj8cxTEqIaBhGTLfojSZMS7UGK1LLtMyHI6kP7sOiLfi2W4/W7XV72F79TzXIa2ZBuO57bhnAZ/VzGNj4PRNezfRqicjsGxcZwXg+TpQj0ew6gSOw7wSbozjsfYXi8PwMnSc52leHotl+MxjmoXh2nybxOH+SQtnYXx+D2P4vGMB56hQf5PCgBYeDwYBCEo1xggebgKH6IIDBYBgkiAQ5FgYPAhEIRgWGqDBoC4GoCiGCBYhGBQPAWdIQp0eIUiWCZigiJgqgqYpIioJQhmIMhBH0NxjEMag2g2Y4ImYOoOmOSJeDQNxXlOLR3ECUAQICA=")
	var_Appearance.Add(2,"gBFLBCJwBAEHhEJAAEhABgsHQAAYAQGKIcBiAKBQAGaAoDDYNwwQwAAxDAKcEwsACEIrjKCRShyCYZRrGUgRCKQahLEiTIhGUYJHgmK4tRoAUgxWCEExrAaQJjjeCQFi6LAtDhPMByfQEZQIGyjkgjNLUcSbG4AKgkCiXfpUAJVP7FcgSABEEigNIxToOU4jFgeCYLQKQRK2RC9GQGFCbLhpYKIahGTYWVheN5XXblez9P7ABQwKCcAwXBp7YIKAT4XBIdYdQ7IL4xGA0AJPFoJC7mOQ5XiYAIBAZ/RL0LCcbxHHafVboQj6JouD5PUDVNY1XBdPynI6CbLhWy6Dq4UZzPwzeBifSHfDjRoJcCZe71KY3GwSEboNA6Kp+QBHAmZoZjSPYIEiF47lOLJVnuYofBwJJHmaQoYj0MIRHeM4/m6cJ8B+fpBHQJ5SGKPYYH8OYMk+P5Bn4fxaAYZAvEIX4RgUWBGgCCAmAqApgkgNgOgMEYlGASoEkQeBWBaBZhggZgagaYRoEwShWA6NZZAMQBAICA==")
oG2antt.Background(0,16777216 /*0x1000000*/)
oG2antt.Background(41,33554432 /*0x2000000*/)
oG2antt.Background(32,-1)
oG2antt.HeaderHeight = 28
oG2antt.BackColorHeader = RGB(255,255,255)
oG2antt.DrawGridLines = -2
oG2antt.HeaderVisible = 1
var_Columns = oG2antt.Columns
	var_Columns.Add("C1").DisplayFilterButton = true
	var_Column = var_Columns.Add("C2")
		var_Column.DisplayFilterButton = true
		var_Column.Filter = "Item 2"
		var_Column.FilterType = 240
	var_Columns.Add("C3").DisplayFilterButton = true
var_Items = oG2antt.Items
	h = var_Items.AddItem("Item 1")
	var_Items.CellValue(h,1,"Item 2")
	var_Items.CellValue(h,2,"Item 3")
	h = var_Items.AddItem("Item 4")
	var_Items.CellValue(h,1,"Item 5")
	var_Items.CellValue(h,2,"Item 6")
oG2antt.ApplyFilter()
oG2antt.EndUpdate()
|
|
2172
|
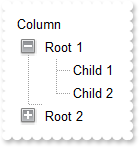
How can I make the expand/collapse glyphs DPI aware
OleObject oG2antt,var_Appearance,var_Items
any h,size

oG2antt = ole_1.Object
size = 2
oG2antt.BeginUpdate()
var_Appearance = oG2antt.VisualAppearance
	var_Appearance.Add(3,"gBFLBCJwBAEHhEJAAEhEGAUHQAAYAQGKIcBiAKBQAGaAoDDYOA4QwAAxDAKcEwsACEIrjKCRShyCYZRhGcTSBCIZBqEqSZLiEZRQiiCYsS5GQBRfIUEghGyNZjgNzQcCQAI8T5IUgARBJIDSMY6DpOIxYHgmC4DEITNLxOK0EhRHCBZrgOCAYhqEY1Ro+dhPFYjVTMdK0LRtKy7Mq2aJmOpZDxWE7dZKpO5fbxXS67cr2fp/YBed4rfa7KTlOBKcRQRBEFQPDqPZBkORZHh2FoLRJKbgtHJmHYNQWhVyYBbNCyTI6lahpeuHBx1QaWWxjbCMEr6bpoWLbFi3Ha1UzrPa8b5vSw7Gr+HzYQTHGPXGqaYJdZrnea6B7+U5XUJrnSOZciYHwhAeR5HDK+JVGqKRRmScx5HyfRei+H5bmmcp4Fi8o/CGGJKGQKZUGoFQigUPIiCeSZXnyHB6l0SAJn8JxfkIeZ5CgXxjCCAhyB8QgIlAM4MlKAIcCaIBIGYGoGGEYhqBMMxgnICgRDUDQjESGwmAkWBuCqBoiHIVgkDQYgYESWg2E0YhohcJQigITg3CQSRyEyEYGGOWJwhQJD4FiFIMk0aJFGsIBkkOBJeDc+AchYJwJgIWhSgYZQpFIVoVGOGQ4l2EwIBWMhgDmDhThCEwkAiaJchKDhjhgZhsCUY4iFCEoZkiaYQmSGAWhWQhgDuDpTjCDQiEgchAg0IpJBoDoFiEKBqCaCAimgIguH8IZnkPUhcBcJg+hGJZnloYJsiaKZKGa24YnWSR0CkKhCA2CxlCqColhAYpqEKER0DqVZ0A0ASAgA==")
	var_Appearance.Add(4,"gBFLBCJwBAEHhEJAAEhABAQCg6AADACAxRDgMQBQKAAzQFAYbBwHCGAAGIYBTgmFgAQhFcZQSKUOQTDKNYykCIRSDUJYkSZEIyjBI8ExXFqNACjeQYJBCNYbTJAbqhYIgAR3HqQZABCCSQKkYx0HScRiwPBMFwGIQmaaicZoJCiN4DTZAcIBRDUIxpDR9bBeKw3KqVaZnWhaNpWXZlTzKdSxXisF67RZSdi/XgvF5XXblez9P69LwXe5mUrGbyVYghCCIKgeG4dR7IMhyLDcKQXCCVW7aGSsOwbAqAXpdGAXTQdDyLJKnaZqOi6BjjA4rNbHGIYJb1XTRMa1LJuG5LJrOeZ3Xre4BLfh1VoFRpjWIYNY1QS7TLOczzfRdDxTiGVpkjCeJoD4Ng1hSRxiisVRKg8D4PkWZJznmPQ+F8Xx5guWpjHGWYMiYQodEaIRSCgU5KCSeh3naHB/iAAh9n8fwfgIeZ1CgXwjCCAhxl8AgIlAM4MlKAIcCaD54FYFoFmGCBmBaBIJigPJNgKSAoDSVC+BIbIYCUYYoiYKoJgkWIMlGCAglMaJZDWCYiFyFIJkkOJYhEJc7G4PYPCOaJshQJBjgiVIUgyDRokEaggGSQ4El4N1CBiFgnAmAhaFKFZlFkShUhWJRYmITg3GSQgFGuGBOGOFJkCSSQCDoNgkiOCY0hUJJmmmQhvhqZtYmUOQmBWIRvhgTpjjSbAjEiEgchBZgyEaBIhigWgegqIhIjoDILiACB5nTL5WnWRYOiSKYJnqGQ7CmOh2hqJ5OkYORxFyShKhSAxihkOomioY5YiqFIkFyTo1HkAxAEAgIA==")
	var_Appearance.Add(1,oG2antt.FormatABC("`CP:3 -` + int(value*dpi) + ` -` + int(value*dpi) + ` ` +  int(value*dpi) + ` ` + int(value*dpi)",size))
	var_Appearance.Add(2,oG2antt.FormatABC("`CP:4 -` + int(value*dpi) + ` -` + int(value*dpi) + ` ` +  int(value*dpi) + ` ` + int(value*dpi)",size))
oG2antt.LinesAtRoot = 1
oG2antt.HasButtons = 4
oG2antt.HasButtonsCustom(false,16777216)
oG2antt.HasButtonsCustom(true,33554432)
oG2antt.Columns.Add("Column")
var_Items = oG2antt.Items
	h = var_Items.AddItem("Root 1")
	var_Items.InsertItem(h,,"Child 1")
	var_Items.InsertItem(h,,"Child 2")
	var_Items.ExpandItem(h,true)
	h = var_Items.AddItem("Root 2")
	var_Items.InsertItem(h,,"Child")
oG2antt.EndUpdate()
|
|
2171
|
Is it possible to highlight the column's header once a filter is applied (sample 1)
OleObject oG2antt,var_Appearance,var_Column,var_Columns,var_Items
any h

oG2antt = ole_1.Object
oG2antt.BeginUpdate()
var_Appearance = oG2antt.VisualAppearance
	var_Appearance.Add(2,"gBFLBCJwBAEHhEJAAEhABX8GACAADACAxSDEMQBQKAAzQFAYbhgHCGAAGQaBUgmFgAQhFcZQSKUOQTDKNYykCIRSDUJYkSZEIyjBI8ExXFqNACkGKwYgmNYiTLAcgANJ0WBaGIZJ4gOT5fDKMoEDRRYADFCscwxJybQAqGQKKb+VgAVY/cTyBIAEQSKA0TDOQ5TSKWB4JPZQRBEbZMNBtBIUJquKaqShdQJCU5FdY3Xblez9P7AMBwLFEC4NQ8YNYuPhjR4dRTIMhvVAsUArFh8Zg9GZZFjmDIDT4ydBLTQwcyVIKnP5qOa6XbmPoCQDYKxZHYxPzVDa3axuL76dqCAT7XrXNy1TbNRrzQKfcJqfCbdw2YaDZLOOT3fjuI4hhKaRzFAHJ+jYQ4xHuY4gHuGIXGeExqC8Tp6C+PoEm+G5ImycRgh0XwvDGa5rgOeoejyXwnFeQp2mkf5ClgBB9gCWIYAwfYAEKV58mkdwOggNArgOXY2EWLoDkKOA0mgbhOGgZApgaSBIHWSYHSmbApgYThmESZYJkIeIkgeCpfliLIHgpMIcmUYYYmODAlg2SI4mWfRfGOEguDcCRjFYAJihCQhJBSDoRmONgKEcI4kFCEJhhOVYTmYnAlEAQhWBMJYJGYWoWmWSR2F6F5lnkWAQhUAgpEieRWEuSYkjWGpmkmNhuhuZwJkYcocmaaYkjyEhngnUA6lEFAlAEgI=")
	var_Appearance.Add(1,"CP:2 -8 -4 2 4")
oG2antt.Background(0,33488638 /*0x1fefefe*/)
oG2antt.Background(41,16843009 /*0x1010101*/)
oG2antt.Background(32,-1)
oG2antt.HeaderHeight = 28
oG2antt.BackColorHeader = RGB(255,255,255)
oG2antt.DrawGridLines = -2
oG2antt.HeaderVisible = 1
var_Columns = oG2antt.Columns
	var_Columns.Add("C1").DisplayFilterButton = true
	var_Column = var_Columns.Add("C2")
		var_Column.DisplayFilterButton = true
		var_Column.Filter = "Item 2"
		var_Column.FilterType = 240
	var_Columns.Add("C3").DisplayFilterButton = true
var_Items = oG2antt.Items
	h = var_Items.AddItem("Item 1")
	var_Items.CellValue(h,1,"Item 2")
	var_Items.CellValue(h,2,"Item 3")
	h = var_Items.AddItem("Item 4")
	var_Items.CellValue(h,1,"Item 5")
	var_Items.CellValue(h,2,"Item 6")
oG2antt.ApplyFilter()
oG2antt.EndUpdate()
|
|
2170
|
How do I update itemcount and matchitemcount of the FilterBarCaption after I added the item using the AddItem method
/*begin event Click() - Occurs when the user presses and then releases the left mouse button over the tree control.*/
/*
	oG2antt = ole_1.Object
	oG2antt.Items.AddItem("new")
	oG2antt.Refresh()
*/
/*end event Click*/

OleObject oG2antt,var_Column,var_Column1,var_Items

oG2antt = ole_1.Object
oG2antt.BeginUpdate()
oG2antt.Chart.PaneWidth(true,0)
var_Column = oG2antt.Columns.Add("Item")
	var_Column.DisplayFilterButton = true
	var_Column.FilterList = 9504 /*exShowExclude | exShowFocusItem | exShowCheckBox | exSortItemsAsc*/
var_Column1 = oG2antt.Columns.Add("Pos")
	var_Column1.AllowSizing = false
	var_Column1.AllowSort = false
	var_Column1.Width = 32
	var_Column1.FormatColumn = "1 apos ``"
	var_Column1.Position = 0
var_Items = oG2antt.Items
	var_Items.AddItem("Item A")
	var_Items.AddItem("Item B")
	var_Items.AddItem("Item C")
oG2antt.FilterBarCaption = "`<r>` + value + `</b><fgcolor=808080>` + ( matchitemcount < 0 ? ( ( len(value) ? `<br>` : `` ) + `<r>` + abs(matchitemcount + 1) + ` result(s)` ) : (`<fgcolor=808080>`+ itemcount + ` item(s)`) )"
oG2antt.FilterBarPromptVisible = 3591 /*exFilterBarCompact | exFilterBarShowCloseOnRight | exFilterBarShowCloseIfRequired | exFilterBarCaptionVisible | exFilterBarVisible | exFilterBarPromptVisible*/
oG2antt.EndUpdate()
|
|
2169
|
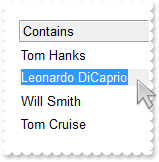
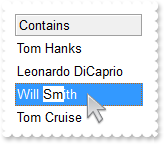
The Edit method does not work while ReadOnly property is exLocked and the first column is hidden. Is there any fix
/*begin event DblClick(integer  Shift, long  X, long  Y) - Occurs when the user dblclk the left mouse button over an object.*/
/*
	any var_ItemFromPoint
	oG2antt = ole_1.Object
	var_ItemFromPoint = oG2antt.ItemFromPoint(-1,-1,c,hit)
	oG2antt.FocusColumnIndex = c
	oG2antt.Edit()
*/
/*end event DblClick*/

OleObject oG2antt,var_Column,var_Items

oG2antt = ole_1.Object
oG2antt.BeginUpdate()
oG2antt.Chart.PaneWidth(true,0)
oG2antt.HeaderAppearance = 4
oG2antt.AutoEdit = false
oG2antt.ReadOnly = 1
oG2antt.AutoSearch = true
oG2antt.Columns.Add("").Visible = false
var_Column = oG2antt.Columns.Add("Contains")
	var_Column.AutoSearch = 1
	var_Column.Editor.EditType = 1
var_Items = oG2antt.Items
	var_Items.CellValue(var_Items.AddItem(),1,"Tom Hanks")
	var_Items.CellValue(var_Items.AddItem(),1,"Leonardo DiCaprio")
	var_Items.CellValue(var_Items.AddItem(),1,"Will Smith")
	var_Items.CellValue(var_Items.AddItem(),1,"Tom Cruise")
oG2antt.EndUpdate()
|
|
2168
|
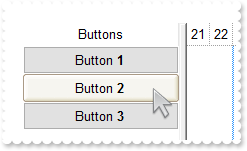
How can I highlight the cell's button with a different appearance, when cursor hovers it
OleObject oG2antt,var_Column,var_Items

oG2antt = ole_1.Object
oG2antt.BeginUpdate()
oG2antt.VisualAppearance.Add(1,"c:\exontrol\images\normal.ebn")
oG2antt.DefaultItemHeight = 22
oG2antt.TreeColumnIndex = -1
oG2antt.SelForeColor = RGB(0,0,0)
oG2antt.SelBackColor = oG2antt.BackColor
oG2antt.Background(157,16777216 /*0x1000000*/)
var_Column = oG2antt.Columns.Add("Buttons")
	var_Column.Def(2,true)
	var_Column.Def(17,1)
	var_Column.Alignment = 1
	var_Column.HeaderAlignment = 1
var_Items = oG2antt.Items
	var_Items.AddItem("Button <b>1</b>")
	var_Items.AddItem("Button <b>2</b>")
	var_Items.AddItem("Button <b>3</b>")
oG2antt.EndUpdate()
|
|
2167
|
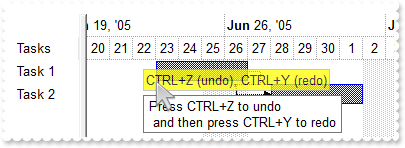
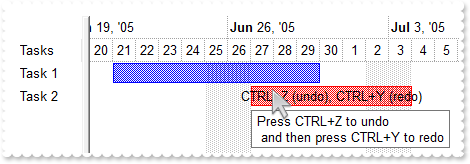
How to group one or more operations into a block when the user do undo or redo
OleObject oG2antt,var_Chart,var_Items,var_Note
any h

oG2antt = ole_1.Object
oG2antt.BeginUpdate()
oG2antt.Columns.Add("Tasks")
var_Chart = oG2antt.Chart
	var_Chart.AllowUndoRedo = true
	var_Chart.FirstVisibleDate = 2005-06-20
	var_Chart.AllowLinkBars = true
	var_Chart.LevelCount = 2
	var_Chart.PaneWidth(false,64)
	var_Chart.Bars.Item("Task").Height = 16
var_Items = oG2antt.Items
	var_Items.StartBlockUndoRedo()
	var_Items.AddBar(var_Items.AddItem("Task 1"),"Task",2005-06-23,2005-06-27,"")
	var_Items.AddBar(var_Items.AddItem("Task 2"),"Task",2005-06-28,2005-07-02,"")
	var_Items.AddLink("L1",var_Items.ItemByIndex(0),"",var_Items.ItemByIndex(1),"")
	var_Items.EndBlockUndoRedo()
	h = var_Items.ItemByIndex(1)
var_Note = oG2antt.Chart.Notes.Add("NoteD",h,2005-06-26,"CTRL+Z (undo), CTRL+Y (redo)")
	var_Note.PartShadow(1,false)
	var_Note.PartToolTip(1,"Press CTRL+Z to undo <br> and then press CTRL+Y to redo")
	var_Note.PartTransparency(1,25)
	var_Note.PartVOffset(1,-2)
	var_Note.PartBackColor(1,RGB(255,255,0))
oG2antt.EndUpdate()
|
|
2166
|
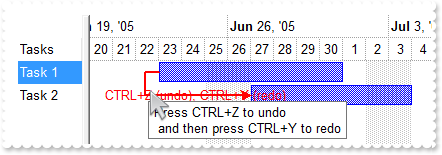
I am using the Link property to customize the link, but when I press redo it (CTRL+Y) to redo it, not all properties are restored. What can be done
OleObject oG2antt,var_Chart,var_Items
any u

oG2antt = ole_1.Object
oG2antt.BeginUpdate()
oG2antt.Columns.Add("Tasks")
var_Chart = oG2antt.Chart
	var_Chart.AllowUndoRedo = true
	var_Chart.FirstVisibleDate = 2005-06-20
	var_Chart.AllowLinkBars = true
	var_Chart.LevelCount = 2
	var_Chart.PaneWidth(false,64)
	var_Chart.Bars.Item("Task").Height = 16
var_Items = oG2antt.Items
	var_Items.AddBar(var_Items.AddItem("Task 1"),"Task",2005-06-23,2005-07-01,"")
	var_Items.AddBar(var_Items.AddItem("Task 2"),"Task",2005-06-27,2005-07-04,"")
	var_Items.StartBlockUndoRedo()
	var_Items.AddLink("L1",var_Items.ItemByIndex(0),"",var_Items.ItemByIndex(1),"")
	u = var_Items.StartUpdateLink("L1")
	var_Items.Link("L1",10,2)
	var_Items.Link("L1",12,"<fgcolor FF0000>CTRL+Z (undo), CTRL+Y (redo)")
	var_Items.Link("L1",13,"Press CTRL+Z to undo <br> and then press CTRL+Y to redo")
	var_Items.Link("L1",6,0)
	var_Items.Link("L1",8,255)
	var_Items.EndUpdateLink(u)
	var_Items.EndBlockUndoRedo()
oG2antt.EndUpdate()
|
|
2165
|
I am using the ItemBar property to customize the task, but when I press redo it (CTRL+Y) to redo it, not all properties are restored. What can be done
OleObject oG2antt,var_Chart,var_Items
any h,u

oG2antt = ole_1.Object
oG2antt.BeginUpdate()
oG2antt.Columns.Add("Tasks")
var_Chart = oG2antt.Chart
	var_Chart.AllowUndoRedo = true
	var_Chart.FirstVisibleDate = 2005-06-20
	var_Chart.AllowLinkBars = true
	var_Chart.LevelCount = 2
	var_Chart.PaneWidth(false,64)
	var_Chart.Bars.Item("Task").Height = 16
var_Items = oG2antt.Items
	var_Items.AddBar(var_Items.AddItem("Task 1"),"Task",2005-06-21,2005-06-30,"")
	h = var_Items.AddItem("Task 2")
	var_Items.StartBlockUndoRedo()
	var_Items.AddBar(h,"Task",2005-06-27,2005-07-04,"","CTRL+Z (undo), CTRL+Y (redo)")
	u = var_Items.StartUpdateBar(h,"")
	var_Items.ItemBar(h,"",33,255)
	var_Items.ItemBar(h,"",6,"Press CTRL+Z to undo <br> and then press CTRL+Y to redo")
	var_Items.EndUpdateBar(u)
	var_Items.EndBlockUndoRedo()
oG2antt.EndUpdate()
|
|
2164
|
The incremental search feature is no working for columns with editor assigned. What can be done
/*begin event DblClick(integer  Shift, long  X, long  Y) - Occurs when the user dblclk the left mouse button over an object.*/
/*
	oG2antt = ole_1.Object
	oG2antt.Edit()
*/
/*end event DblClick*/

OleObject oG2antt,var_Column,var_Items

oG2antt = ole_1.Object
oG2antt.BeginUpdate()
oG2antt.Chart.PaneWidth(true,0)
oG2antt.HeaderAppearance = 4
oG2antt.AutoEdit = false
oG2antt.AutoSearch = true
var_Column = oG2antt.Columns.Add("Contains")
	var_Column.AutoSearch = 1
	var_Column.Editor.EditType = 1
var_Items = oG2antt.Items
	var_Items.AddItem("Tom Hanks")
	var_Items.AddItem("Leonardo DiCaprio")
	var_Items.AddItem("Will Smith")
	var_Items.AddItem("Tom Cruise")
oG2antt.EndUpdate()
|
|
2163
|
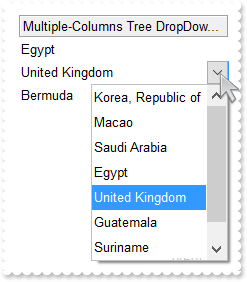
Each item is representated by a key as string. Is it possible to have a drop down editor to display more information when using the item's key
OleObject oG2antt,var_Editor,var_Items

oG2antt = ole_1.Object
oG2antt.BeginUpdate()
oG2antt.Chart.PaneWidth(true,0)
oG2antt.HeaderAppearance = 4
var_Editor = oG2antt.Columns.Add("Multiple-Columns Tree DropDownListType").Editor
	var_Editor.EditType = 3
	var_Editor.AddItem(0,"KR|Korea, Republic of")
	var_Editor.AddItem(1,"MO|Macao")
	var_Editor.AddItem(2,"SA|Saudi Arabia")
	var_Editor.AddItem(3,"EG|Egypt")
	var_Editor.AddItem(4,"GB|United Kingdom")
	var_Editor.AddItem(5,"GT|Guatemala")
	var_Editor.AddItem(6,"SR|Suriname")
	var_Editor.AddItem(7,"BM|Bermuda")
var_Items = oG2antt.Items
	var_Items.AddItem("EG")
	var_Items.AddItem("GB")
	var_Items.AddItem("BM")
oG2antt.EndUpdate()
|
|
2162
|
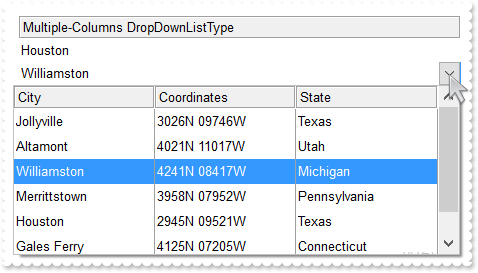
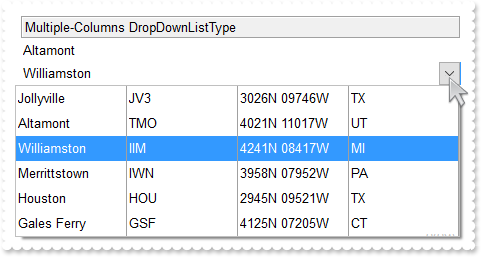
My table includes codes/keys for items, can I display a drop down editor to include more information
OleObject oG2antt,var_Editor,var_Items
oG2antt = ole_1.Object
oG2antt.BeginUpdate()
oG2antt.Chart.PaneWidth(true,0)
oG2antt.HeaderAppearance = 4
var_Editor = oG2antt.Columns.Add("Multiple-Columns DropDownListType").Editor
var_Editor.EditType = 3
var_Editor.DropDownAutoWidth = 0
var_Editor.Option(57,"City�Coordinates�State")
var_Editor.AddItem(0,"JV3|Jollyville�3026N 09746W�Texas")
var_Editor.AddItem(1,"TMO|Altamont�4021N 11017W�Utah")
var_Editor.AddItem(2,"IIM|Williamston�4241N 08417W�Michigan")
var_Editor.AddItem(3,"IWN|Merrittstown�3958N 07952W�Pennsylvania")
var_Editor.AddItem(4,"HOU|Houston�2945N 09521W�Texas")
var_Editor.AddItem(5,"GSF|Gales Ferry�4125N 07205W�Connecticut")
var_Items = oG2antt.Items
var_Items.AddItem("HOU")
var_Items.AddItem("IIM")
var_Items.AddItem("TMO")
oG2antt.EndUpdate()
|
|
2161
|
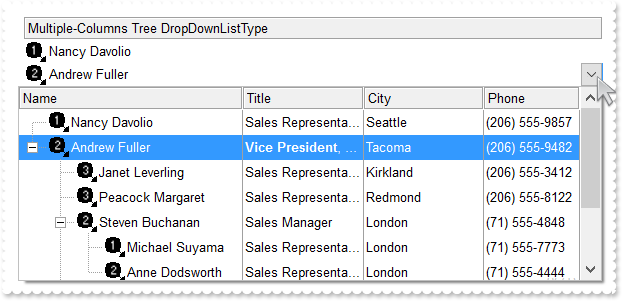
How can I display and select from a multiple-columns tree editor
OleObject oG2antt,var_Editor,var_Items
oG2antt = ole_1.Object
oG2antt.BeginUpdate()
oG2antt.Chart.PaneWidth(true,0)
oG2antt.Images("gBJJgBAIDAAGAAEAAQhYAf8Pf4hh0QihCJo2AEZjQAjEZFEaIEaEEaAIAkcbk0olUrlktl0vmExmUzmk1m03nE5nU7nk9n0/oFBoVDolFo1HpFJpVLplNp1PqFRqVTqlVq1XrFZrVbrldr1fsFhsVjslls1ntFptVrtltt1vuFxuVzul1u13vF5vV7vl9v1/wGBwWDwmFw2HxGJxWLxmNx0xiFdyOTh8Tf9ZymXx+QytcyNgz8r0OblWjyWds+m0ka1Vf1ta1+r1mos2xrG2xeZ0+a0W0qOx3GO4NV3WeyvD2XJ5XL5nN51aiw+lfSj0gkUkAEllHanHI5j/cHg8EZf7w8vl8j4f/qfEZeB09/vjLAB30+kZQAP/P5/H6/yNAOAEAwCjMBwFAEDwJBMDwLBYAP2/8Hv8/gAGAD8LQs9w/nhDY/oygIA=")
oG2antt.HeaderAppearance = 4
var_Editor = oG2antt.Columns.Add("Multiple-Columns Tree DropDownListType").Editor
var_Editor.EditType = 3
var_Editor.DropDownAutoWidth = 0
var_Editor.Option(57,"Name�Title�City�Phone")
var_Editor.Option(58,"224���96")
var_Editor.AddItem(1,"Nancy Davolio�Sales Representative�Seattle�(206) 555-9857",1)
var_Editor.AddItem(2,"Andrew Fuller�<b>Vice President</b>, Sales�Tacoma�(206) 555-9482",2)
var_Editor.InsertItem(3,"Janet Leverling�Sales Representative�Kirkland�(206) 555-3412",3,2)
var_Editor.InsertItem(4,"Peacock Margaret�Sales Representative�Redmond�(206) 555-8122",3,2)
var_Editor.InsertItem(5,"Steven Buchanan�Sales Manager�London�(71) 555-4848",2,2)
var_Editor.InsertItem(6,"Michael Suyama�Sales Representative�London�(71) 555-7773",1,5)
var_Editor.InsertItem(7,"Robert King�Sales Representative�Kirkland�(71) 555-5598",2,2)
var_Editor.InsertItem(8,"Laura Callahan�Inside Sales Coordinator�Seattle�(206) 555-1189",3,2)
var_Editor.InsertItem(9,"Anne Dodsworth�Sales Representative�London�(71) 555-4444",2,5)
var_Editor.ExpandAll()
var_Items = oG2antt.Items
var_Items.AddItem(1)
var_Items.AddItem(2)
var_Items.AddItem(4)
oG2antt.EndUpdate()
|
|
2160
|
Does you control support multiple-columns for a drop down editor
OleObject oG2antt,var_Editor,var_Items
oG2antt = ole_1.Object
oG2antt.BeginUpdate()
oG2antt.Chart.PaneWidth(true,0)
oG2antt.HeaderAppearance = 4
var_Editor = oG2antt.Columns.Add("Multiple-Columns DropDownListType").Editor
var_Editor.EditType = 3
var_Editor.DropDownAutoWidth = 0
var_Editor.AddItem(0,"Jollyville�JV3�3026N 09746W�TX")
var_Editor.AddItem(1,"Altamont�TMO�4021N 11017W�UT")
var_Editor.AddItem(2,"Williamston�IIM�4241N 08417W�MI")
var_Editor.AddItem(3,"Merrittstown�IWN�3958N 07952W�PA")
var_Editor.AddItem(4,"Houston�HOU�2945N 09521W�TX")
var_Editor.AddItem(5,"Gales Ferry�GSF�4125N 07205W�CT")
var_Items = oG2antt.Items
var_Items.InsertItem(0,"",1)
var_Items.InsertItem(0,"",2)
var_Items.InsertItem(0,"",4)
oG2antt.EndUpdate()
|
|
2159
|
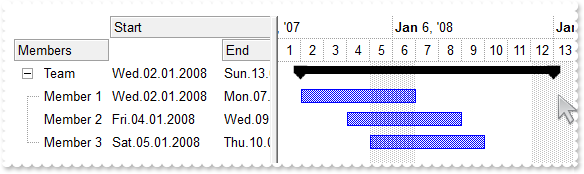
Is it possible to change the summary-bar's start or/and end margins
OleObject oG2antt,var_Chart,var_Column,var_Column1,var_Items
any h1,hR1

oG2antt = ole_1.Object
oG2antt.BeginUpdate()
oG2antt.HeaderAppearance = 4
oG2antt.LinesAtRoot = 5
oG2antt.ColumnAutoResize = false
var_Chart = oG2antt.Chart
	var_Chart.AllowCreateBar = false
	var_Chart.AllowLinkBars = false
	var_Chart.FirstVisibleDate = 2008-01-01
	var_Chart.LevelCount = 2
	var_Chart.PaneWidth(false,256)
oG2antt.Columns.Add("Members").Width = 96
var_Column = oG2antt.Columns.Add("Start")
	var_Column.Width = 112
	var_Column.Def(18,1)
	var_Column.LevelKey = 1
var_Column1 = oG2antt.Columns.Add("End")
	var_Column1.Width = 112
	var_Column1.Def(18,2)
	var_Column1.LevelKey = 1
var_Items = oG2antt.Items
	var_Items.AllowCellValueToItemBar = true
	hR1 = var_Items.AddItem("Team")
	var_Items.AddBar(hR1,"Summary",2008-01-02,2008-01-08,"")
	var_Items.AddBar(hR1,"",2008-01-13,2008-01-13,"R")
	var_Items.ItemBar(hR1,"R",19,100)
	var_Items.DefineSummaryBars(hR1,"",h1,"R")
	h1 = var_Items.InsertItem(hR1,,"Member 1")
	var_Items.AddBar(h1,"Task",2008-01-02,2008-01-07)
	var_Items.DefineSummaryBars(hR1,"",h1,"")
	h1 = var_Items.InsertItem(hR1,,"Member 2")
	var_Items.AddBar(h1,"Task",2008-01-04,2008-01-09)
	var_Items.DefineSummaryBars(hR1,"",h1,"")
	h1 = var_Items.InsertItem(hR1,,"Member 3")
	var_Items.AddBar(h1,"Task",2008-01-05,2008-01-10)
	var_Items.DefineSummaryBars(hR1,"",h1,"")
	var_Items.ExpandItem(hR1,true)
oG2antt.EndUpdate()
|
|
2158
|
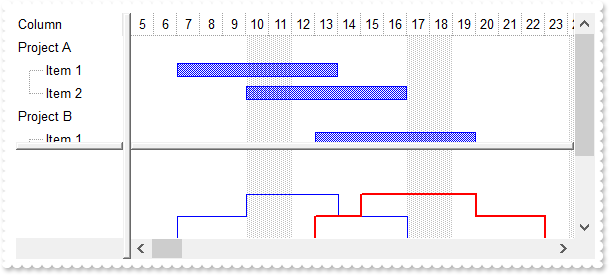
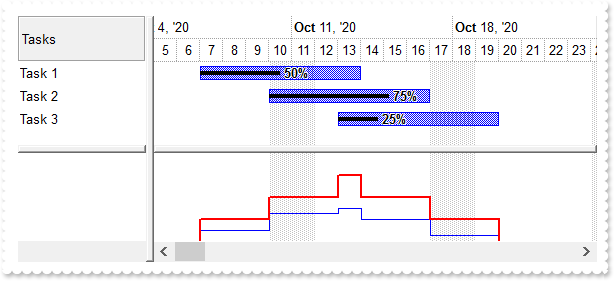
I want to display two lines/curves in the histogram-area such as expected and actual work effor per month. How can I do that (leaf)
OleObject oG2antt,var_Bar,var_Bar1,var_Chart,var_Items
any h

oG2antt = ole_1.Object
oG2antt.BeginUpdate()
var_Chart = oG2antt.Chart
	var_Chart.PaneWidth(false,128)
	var_Chart.FirstVisibleDate = 2020-10-05
	var_Chart.HistogramVisible = true
	var_Chart.HistogramHeight = 96
	var_Chart.HistogramView = 1808 /*exHistogramNoGrouping | exHistogramRecLeafItems | exHistogramLeafItems | exHistogramUnlockedItems*/
	var_Bar = var_Chart.Bars.Item("Task")
		var_Bar.HistogramPattern = 2048
		var_Bar.HistogramItems = -4
		var_Bar.HistogramBorderSize = 1
	var_Bar1 = var_Chart.Bars.Copy("Task","C")
		var_Bar1.HistogramPattern = 2048
		var_Bar1.HistogramItems = -4
		var_Bar1.HistogramColor = RGB(255,0,0)
		var_Bar1.HistogramBorderSize = 2
oG2antt.Columns.Add("Column")
var_Items = oG2antt.Items
	h = var_Items.AddItem("Project A")
	var_Items.AddBar(var_Items.InsertItem(h,,"Item 1"),"Task",2020-10-07,2020-10-14)
	var_Items.AddBar(var_Items.InsertItem(h,,"Item 2"),"Task",2020-10-10,2020-10-17)
	var_Items.ExpandItem(h,true)
	h = var_Items.AddItem("Project B")
	var_Items.AddBar(var_Items.InsertItem(h,,"Item 1"),"C",2020-10-13,2020-10-20)
	var_Items.AddBar(var_Items.InsertItem(h,,"Item 2"),"C",2020-10-15,2020-10-23)
	var_Items.ExpandItem(h,true)
oG2antt.EndUpdate()
|
|
2157
|
I want to display two lines/curves in the histogram-area such as expected and actual work effor per month. How can I do that (flat)
/*begin event BarResize(long  Item, any  Key) - Occurs when a bar is moved or resized.*/
/*
	OleObject var_Items
	oG2antt = ole_1.Object
	var_Items = oG2antt.Items
		var_Items.ItemBar(Item,Key,21,var_Items.ItemBar(Item,Key,12))
		var_Items.ItemBar(Item,"C",21,1)
*/
/*end event BarResize*/

OleObject oG2antt,var_Bar,var_Bar1,var_Chart,var_Items
any h

oG2antt = ole_1.Object
oG2antt.BeginUpdate()
oG2antt.HeaderVisible = 1
oG2antt.HeaderAppearance = 4
var_Chart = oG2antt.Chart
	var_Chart.FirstVisibleDate = 2020-10-05
	var_Chart.PaneWidth(false,128)
	var_Chart.LevelCount = 2
	var_Chart.HistogramHeight = 96
	var_Chart.HistogramVisible = true
	var_Bar = var_Chart.Bars.Add("Task%Progress")
		var_Bar.HistogramPattern = 2048
		var_Bar.HistogramItems = -4
		var_Bar.HistogramBorderSize = 1
		var_Bar.HistogramBorderColor = var_Bar.Color
		var_Bar.Shortcut = "P"
		var_Bar.Def(14,true)
	var_Bar1 = var_Chart.Bars.Copy("Task","C")
		var_Bar1.HistogramPattern = 2048
		var_Bar1.HistogramColor = RGB(255,0,0)
		var_Bar1.HistogramBorderSize = 2
oG2antt.Columns.Add("Tasks").FormatColumn = "`Task ` + (1 index ``)"
var_Items = oG2antt.Items
	h = var_Items.AddItem()
	var_Items.AddBar(h,"P",2020-10-07,2020-10-14,"P")
	var_Items.ItemBar(h,"P",12,0.5)
	var_Items.AddBar(h,"C",2020-10-07,2020-10-14,"C")
	var_Items.ItemBar(h,"C",19,100)
	var_Items.GroupBars(h,"P",true,h,"C",true)
	var_Items.GroupBars(h,"P",false,h,"C",false)
	h = var_Items.AddItem()
	var_Items.AddBar(h,"P",2020-10-10,2020-10-17,"P")
	var_Items.ItemBar(h,"P",12,0.75)
	var_Items.AddBar(h,"C",2020-10-10,2020-10-17,"C")
	var_Items.ItemBar(h,"C",19,100)
	var_Items.GroupBars(h,"P",true,h,"C",true)
	var_Items.GroupBars(h,"P",false,h,"C",false)
	h = var_Items.AddItem()
	var_Items.AddBar(h,"P",2020-10-13,2020-10-20,"P")
	var_Items.ItemBar(h,"P",12,0.25)
	var_Items.AddBar(h,"C",2020-10-13,2020-10-20,"C")
	var_Items.ItemBar(h,"C",19,100)
	var_Items.GroupBars(h,"P",true,h,"C",true)
	var_Items.GroupBars(h,"P",false,h,"C",false)
oG2antt.EndUpdate()
|
|
2156
|
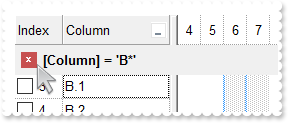
Is it possible to show the filterbar on top of the rows
OleObject oG2antt,var_Column,var_Column1,var_Items

oG2antt = ole_1.Object
oG2antt.BeginUpdate()
oG2antt.FilterBarPromptVisible = 8192
oG2antt.HeaderHeight = 24
oG2antt.FilterBarHeight = oG2antt.HeaderHeight
oG2antt.HeaderAppearance = 1
oG2antt.DrawGridLines = -1
oG2antt.GridLineStyle = 512
var_Column = oG2antt.Columns.Add("Column")
	var_Column.DisplayFilterButton = true
	var_Column.FilterType = 3
	var_Column.Filter = "B*"
var_Column1 = oG2antt.Columns.Add("Index")
	var_Column1.FormatColumn = "1 index ``"
	var_Column1.Position = 0
	var_Column1.Width = 48
	var_Column1.AllowSizing = false
	var_Column1.SortType = 1
	var_Column1.Def(0,true)
var_Items = oG2antt.Items
	var_Items.AddItem("A.1")
	var_Items.AddItem("A.2")
	var_Items.AddItem("B.1")
	var_Items.AddItem("B.2")
	var_Items.AddItem("B.3")
	var_Items.AddItem("C")
oG2antt.ApplyFilter()
oG2antt.EndUpdate()
|
|
2155
|
The deadline symbol is now a white arrow and it is difficult to see. I want to create a green or black arrow for showing deadline
OleObject oG2antt,var_Bar,var_Chart,var_Items

oG2antt = ole_1.Object
oG2antt.BeginUpdate()
oG2antt.Columns.Add("Task")
var_Chart = oG2antt.Chart
	var_Chart.FirstVisibleDate = 2001-01-01
	var_Chart.PaneWidth(false,96)
	var_Bar = var_Chart.Bars.Item("Deadline")
		var_Bar.StartColor = RGB(0,128,0)
		var_Bar.StartShape = 12
var_Items = oG2antt.Items
	var_Items.AddBar(var_Items.AddItem("Task"),"Deadline",2001-01-02,2001-01-02)
oG2antt.EndUpdate()
|
|
2154
|
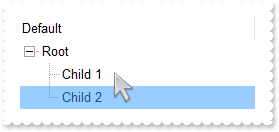
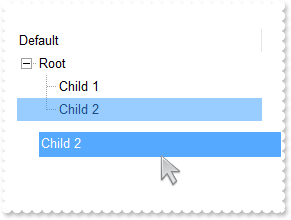
DragDrop (with visual effect)
/*begin event OLEDragDrop(oleobject  Data, long  Effect, integer  Button, integer  Shift, long  X, long  Y) - Occurs when a source component is dropped onto a target component when the source component determines that a drop can occur.*/
/*
	SelectItem(InsertItem(i,, Data.GetData(1))) = True
	OleObject var_Items
	any i
	oG2antt = ole_1.Object
	i = oG2antt.ItemFromPoint(-1,-1,c,hit)
	var_Items = oG2antt.Items
		var_Items.ExpandItem(i,true)
*/
/*end event OLEDragDrop*/

/*begin event OLEStartDrag(oleobject  Data, long  AllowedEffects) - Occurs when the OLEDrag method is called.*/
/*
	Data.SetData(Me.Items.CellCaption(FocusItem, 0), 1)
	oG2antt = ole_1.Object
	AllowedEffects = 1
*/
/*end event OLEStartDrag*/

OleObject oG2antt,var_Items
any h

oG2antt = ole_1.Object
oG2antt.VisualAppearance.Add(1,"gBFLBCJwBAEHhEJAAEhABPUIQAAYAQGKIcBiAKBQAGaAoDgYN4MAANAwjJBMKgBBCLIxhEYobgmGIaRjEEQDCKYcxHCaIBiGcaIfDEBIeSBHcgRbAcOQHGSZZBhGRJGjuKIbSrLICzBDUcRnGwAKQoaaaEomHwyAZOYwDAIoWhpKKCKjqWJKNb+XgAAJTES0RRVRTNAZ1YghGAQgIA==")
oG2antt.Background(96,16777216 /*0x1000000*/)
oG2antt.Background(97,RGB(1,0,0))
oG2antt.Background(33,RGB(0,0,0))
oG2antt.Background(34,RGB(255,255,255))
oG2antt.OLEDropMode = 1
oG2antt.AutoDrag = 196608
oG2antt.LinesAtRoot = -1
oG2antt.Indent = 16
oG2antt.SelBackMode = 1
oG2antt.Columns.Add("Default")
var_Items = oG2antt.Items
	h = var_Items.AddItem("Root")
	var_Items.InsertItem(h,,"Child 1")
	var_Items.InsertItem(h,,"Child 2")
	var_Items.ExpandItem(h,true)
MessageBox("Information",string( "You can:" ))
MessageBox("Information",string( "A) left-click to drag and drop items between controls (open a new exhelper and run the same sample)" ))
MessageBox("Information",string( "B) right-click to re-arrange the item position inside the same control" ))
MessageBox("Information",string( "This sample shows how you can insert the data being dropped as a child of the item being hovered." ))
|
|
2153
|
DragDrop (with no visual effect, hide item while drag and drop)
/*begin event OLEDragDrop(oleobject  Data, long  Effect, integer  Button, integer  Shift, long  X, long  Y) - Occurs when a source component is dropped onto a target component when the source component determines that a drop can occur.*/
/*
	SelectItem(InsertItem(i,, Data.GetData(1))) = True
	OleObject var_Items
	any i
	oG2antt = ole_1.Object
	i = oG2antt.ItemFromPoint(-1,-1,c,hit)
	var_Items = oG2antt.Items
		var_Items.ExpandItem(i,true)
*/
/*end event OLEDragDrop*/

/*begin event OLEStartDrag(oleobject  Data, long  AllowedEffects) - Occurs when the OLEDrag method is called.*/
/*
	Data.SetData(Me.Items.CellCaption(FocusItem, 0), 1)
	oG2antt = ole_1.Object
	AllowedEffects = 1
*/
/*end event OLEStartDrag*/

OleObject oG2antt,var_Items
any h

oG2antt = ole_1.Object
oG2antt.Background(33,RGB(0,0,0))
oG2antt.Background(34,RGB(255,255,255))
oG2antt.OLEDropMode = 1
oG2antt.AutoDrag = 196608
oG2antt.LinesAtRoot = -1
oG2antt.Indent = 16
oG2antt.SelBackMode = 1
oG2antt.Columns.Add("Default")
var_Items = oG2antt.Items
	h = var_Items.AddItem("Root")
	var_Items.InsertItem(h,,"Child 1")
	var_Items.InsertItem(h,,"Child 2")
	var_Items.ExpandItem(h,true)
MessageBox("Information",string( "You can:" ))
MessageBox("Information",string( "A) left-click to drag and drop items between controls (open a new exhelper and run the same sample)" ))
MessageBox("Information",string( "B) right-click to re-arrange the item position inside the same control" ))
MessageBox("Information",string( "This sample shows how you can insert the data being dropped as a child of the item being hovered." ))
|
|
2152
|
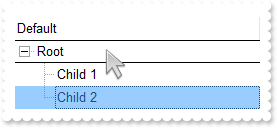
DragDrop
/*begin event OLEDragDrop(oleobject  Data, long  Effect, integer  Button, integer  Shift, long  X, long  Y) - Occurs when a source component is dropped onto a target component when the source component determines that a drop can occur.*/
/*
	SelectItem(InsertItem(i,, Data.GetData(1))) = True
	OleObject var_Items
	any i
	oG2antt = ole_1.Object
	i = oG2antt.ItemFromPoint(-1,-1,c,hit)
	var_Items = oG2antt.Items
		var_Items.ExpandItem(i,true)
*/
/*end event OLEDragDrop*/

/*begin event OLEStartDrag(oleobject  Data, long  AllowedEffects) - Occurs when the OLEDrag method is called.*/
/*
	Data.SetData(Me.Items.CellCaption(FocusItem, 0), 1)
	oG2antt = ole_1.Object
	AllowedEffects = 1
*/
/*end event OLEStartDrag*/

OleObject oG2antt,var_Items
any h

oG2antt = ole_1.Object
oG2antt.OLEDropMode = 1
oG2antt.AutoDrag = 196608
oG2antt.LinesAtRoot = -1
oG2antt.Indent = 16
oG2antt.SelBackMode = 1
oG2antt.Columns.Add("Default")
var_Items = oG2antt.Items
	h = var_Items.AddItem("Root")
	var_Items.InsertItem(h,,"Child 1")
	var_Items.InsertItem(h,,"Child 2")
	var_Items.ExpandItem(h,true)
MessageBox("Information",string( "You can:" ))
MessageBox("Information",string( "A) left-click to drag and drop items between controls (open a new exhelper and run the same sample)" ))
MessageBox("Information",string( "B) right-click to re-arrange the item position inside the same control" ))
MessageBox("Information",string( "This sample shows how you can insert the data being dropped as a child of the item being hovered." ))
|
|
2151
|
Is there anyway to stop the header changing colour when the mouse hovers/moves across the column header (non-clickable)
OleObject oG2antt,var_Column,var_Columns,var_Items

oG2antt = ole_1.Object
oG2antt.BeginUpdate()
oG2antt.HeaderAppearance = 4
var_Columns = oG2antt.Columns
	var_Columns.Add("Item")
	var_Column = var_Columns.Add("Pos")
		var_Column.Position = 0
		var_Column.Width = 32
		var_Column.AllowSizing = false
		var_Column.FormatColumn = "1 index ``"
		var_Column.AllowSort = false
		var_Column.AllowDragging = false
var_Items = oG2antt.Items
	var_Items.AddItem("Item A")
	var_Items.AddItem("Item B")
	var_Items.AddItem("Item C")
oG2antt.EndUpdate()
|
|
2150
|
Is there anyway to stop the header changing colour when the mouse hovers/moves across the column header
OleObject oG2antt,var_Column,var_Columns,var_Items

oG2antt = ole_1.Object
oG2antt.BeginUpdate()
oG2antt.HeaderAppearance = 4
oG2antt.Background(32,-1)
var_Columns = oG2antt.Columns
	var_Columns.Add("Item")
	var_Column = var_Columns.Add("Pos")
		var_Column.Position = 0
		var_Column.Width = 32
		var_Column.AllowSizing = false
		var_Column.FormatColumn = "1 index ``"
		var_Column.AllowSort = false
		var_Column.AllowDragging = false
var_Items = oG2antt.Items
	var_Items.AddItem("Item A")
	var_Items.AddItem("Item B")
	var_Items.AddItem("Item C")
oG2antt.EndUpdate()
|
|
2149
|
How can I detect the last visible item
/*begin event SelectionChanged() - Fired after a new item has been selected.*/
/*
	OleObject var_Items
	oG2antt = ole_1.Object
	var_Items = oG2antt.Items
		MessageBox("Information",string( String(var_Items.NextVisibleItem(var_Items.FocusItem)) ))
*/
/*end event SelectionChanged*/

OleObject oG2antt,var_Items

oG2antt = ole_1.Object
oG2antt.BeginUpdate()
oG2antt.LinesAtRoot = -1
oG2antt.AutoDrag = 3
oG2antt.Columns.Add("Column")
var_Items = oG2antt.Items
	var_Items.InsertItem(var_Items.AddItem("Item 1"),,"Child 1")
	var_Items.AddItem("Item 2")
	var_Items.AddItem("Item 3")
	var_Items.InsertItem(var_Items.AddItem("Item 4"),,"Child 4")
	var_Items.AddItem("Item 5")
oG2antt.EndUpdate()
|
|
2148
|
Is it possible to show the non-working part on the back (behind the item's background)
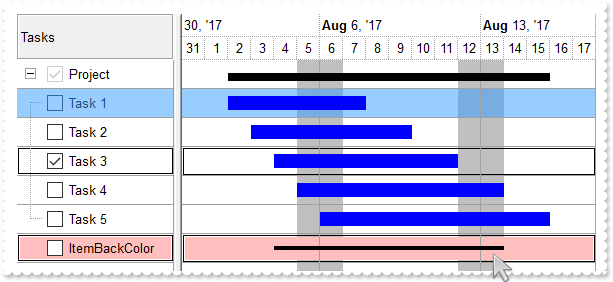
/*begin event CellStateChanged(long  Item, long  ColIndex) - Fired after cell's state has been changed.*/
/*
	oG2antt = ole_1.Object
	oG2antt.Refresh()
*/
/*end event CellStateChanged*/

OleObject oG2antt,var_Appearance,var_Bar,var_Chart,var_Column,var_ConditionalFormat,var_Items
any h,hChild

oG2antt = ole_1.Object
oG2antt.BeginUpdate()
oG2antt.LinesAtRoot = 5
oG2antt.SelBackMode = 1
oG2antt.DefaultItemHeight = 22
oG2antt.GridLineStyle = 48
oG2antt.DrawGridLines = -1
oG2antt.HeaderVisible = 1
oG2antt.HeaderAppearance = 4
var_Column = oG2antt.Columns.Add("Tasks")
	var_Column.Def(0,true)
	var_Column.PartialCheck = true
var_Appearance = oG2antt.VisualAppearance
	var_Appearance.Add(2,"gBFLBCJwBAEHhEJAAEhABUkIQAAYAQGKIcBiAKBQAGYBIJDEMQ3DjAUBjMK4ZwTC4AIQjCK4JDKHYJRpHEZgLBMJAAGIZYhhUYRUiYMkiJBGGDIDiGGI2SJAcbTVIEcx9EyUJSgSTJOjCMokTTIU4TTLYASbJafJJhWSaAiyMouDIOMg1BDNIw/Hika6jOgKUisNJXRzWIBTbDlOQ3JqnbCjOQRSrQBoNDAMAiiaKlbwJPK9RoieQXfwUAJrXJcFqXFSLVxNBKAQEBA=")
	var_Appearance.Add(4,"gBFLBCJwBAEHhEJAAEhABTcIQAAYAQGKIcBiAKBQAGaAoDgYN4MAANAwjJBMKgBBCLIxhEYobgmGIaRiBMIxAKIZhzEiJYgGIZxYh8MQER5IEbyBDsBw5AaZZojGRJGigNIqSxLUhTRKUdQrG4AKQnGhpDgmJYnU5EcrSUKQcw/JaiKYpGZYXpqO5OTzUIyVHDdKgFGKNKwjKiKKp6FofDJcADUcKAYBKFoaLjgS5bXhSGpnV5bFoWdLTVwhBKAQEBA=")
	var_Appearance.Add(1,"CP:2 1 1 -1 -1")
	var_Appearance.Add(3,"CP:4 1 1 -1 -1")
var_ConditionalFormat = oG2antt.ConditionalFormats.Add("%CS0 = 1")
	var_ConditionalFormat.BackColor = 50331648 /*0x3000000*/
	var_ConditionalFormat.ChartBackColor = var_ConditionalFormat.BackColor
var_Chart = oG2antt.Chart
	var_Chart.FirstVisibleDate = 2017-08-01
	var_Chart.LevelCount = 2
	var_Chart.PaneWidth(false,128)
	var_Chart.Bars.Item("Task").Pattern = 1
	var_Bar = var_Chart.Bars.Item("Summary")
		var_Bar.StartShape = 0
		var_Bar.EndShape = 0
		var_Bar.Shape = 4
	var_Chart.SelBackColor = oG2antt.SelBackColor
	var_Chart.SelBarColor = RGB(128,128,128)
	var_Chart.DrawGridLines = -1
	var_Chart.NonworkingDaysPattern = 1
	var_Chart.GridLineStyle = 304 /*exGridLinesBehind | exGridLinesSolid*/
var_Items = oG2antt.Items
	h = var_Items.AddItem("Project")
	hChild = var_Items.InsertItem(h,,"Task 1")
	var_Items.AddBar(hChild,"Task",2017-08-02,2017-08-08)
	var_Items.SelectItem(hChild,true)
	hChild = var_Items.InsertItem(h,,"Task 2")
	var_Items.AddBar(hChild,"Task",2017-08-03,2017-08-10)
	hChild = var_Items.InsertItem(h,,"Task 3")
	var_Items.AddBar(hChild,"Task",2017-08-04,2017-08-12)
	var_Items.CellState(hChild,0,1)
	hChild = var_Items.InsertItem(h,,"Task 4")
	var_Items.AddBar(hChild,"Task",2017-08-05,2017-08-14)
	hChild = var_Items.InsertItem(h,,"Task 5")
	var_Items.AddBar(hChild,"Task",2017-08-06,2017-08-16)
	var_Items.AddBar(h,"Summary",2017-08-01,2017-08-01,"sum")
	var_Items.DefineSummaryBars(h,"sum",-3,"")
	var_Items.ExpandItem(h,true)
	h = var_Items.AddItem("ItemBackColor")
	var_Items.AddBar(h,"Progress",2017-08-04,2017-08-14)
	var_Items.ItemBackColor(h,25198847 /*0x18080ff*/)
	oG2antt.Chart.ItemBackColor(h,25198847 /*0x18080ff*/)
oG2antt.EndUpdate()
|
|
2147
|
How can I hide a bar within the control's overview (sample 1)
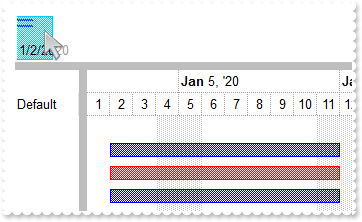
OleObject oG2antt,var_Chart,var_Items
any h

oG2antt = ole_1.Object
oG2antt.BeginUpdate()
oG2antt.Columns.Add("Default")
oG2antt.Background(18,RGB(190,190,190))
oG2antt.BackColorLevelHeader = oG2antt.BackColor
var_Chart = oG2antt.Chart
	var_Chart.LevelCount = 2
	var_Chart.PaneWidth(false,64)
	var_Chart.OverviewHeight = 48
	var_Chart.OverviewVisible = 73730 /*exOverviewSplitter | exOverviewShowMargins | exOverviewShowAllVisible*/
	var_Chart.FirstVisibleDate = 2020-01-01
	var_Chart.Bars.Copy("Task","TaskO").Color = RGB(255,0,0)
var_Items = oG2antt.Items
	var_Items.AddItem("")
	h = var_Items.AddItem("")
	var_Items.AddBar(h,"Task",2020-01-02,2020-01-12,"K1")
	var_Items.AddBar(h,"Task",2020-12-02,2020-12-12,"K2")
	h = var_Items.AddItem("")
	var_Items.AddBar(h,"TaskO",2020-01-02,2020-01-12,"K1")
	var_Items.ItemBar(h,"K1",41,-1)
	var_Items.AddBar(h,"TaskO",2020-12-02,2020-12-12,"K2")
	var_Items.ItemBar(h,"K2",41,-1)
	h = var_Items.AddItem("")
	var_Items.AddBar(h,"Task",2020-01-02,2020-01-12,"K1")
	var_Items.AddBar(h,"Task",2020-12-02,2020-12-12,"K2")
oG2antt.EndUpdate()
|
|
2146
|
How can I hide all bars within the control's overview (sample 2)
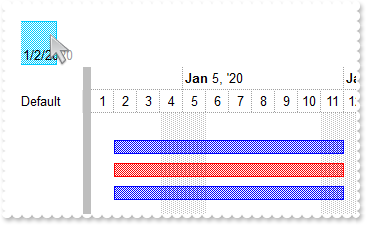
OleObject oG2antt,var_Bar,var_Chart,var_Items
any h

oG2antt = ole_1.Object
oG2antt.BeginUpdate()
oG2antt.Columns.Add("Default")
oG2antt.Background(18,RGB(190,190,190))
oG2antt.BackColorLevelHeader = oG2antt.BackColor
var_Chart = oG2antt.Chart
	var_Chart.LevelCount = 2
	var_Chart.PaneWidth(false,64)
	var_Chart.OverviewHeight = 48
	var_Chart.OverviewVisible = 8705 /*exOverviewShowMargins | exOverviewHideBars | exOverviewShowOnlyVisible*/
	var_Chart.FirstVisibleDate = 2020-01-01
	var_Bar = var_Chart.Bars.Copy("Task","TaskO")
		var_Bar.OverviewColor = -1
		var_Bar.Color = RGB(255,0,0)
var_Items = oG2antt.Items
	var_Items.AddItem("")
	h = var_Items.AddItem("")
	var_Items.AddBar(h,"Task",2020-01-02,2020-01-12,"K1")
	var_Items.AddBar(h,"Task",2020-12-02,2020-12-12,"K2")
	h = var_Items.AddItem("")
	var_Items.AddBar(h,"TaskO",2020-01-02,2020-01-12,"K1")
	var_Items.AddBar(h,"TaskO",2020-12-02,2020-12-12,"K2")
	h = var_Items.AddItem("")
	var_Items.AddBar(h,"Task",2020-01-02,2020-01-12,"K1")
	var_Items.AddBar(h,"Task",2020-12-02,2020-12-12,"K2")
oG2antt.EndUpdate()
|
|
2145
|
How can I hide all bars or specified type within the control's overview (sample 3)
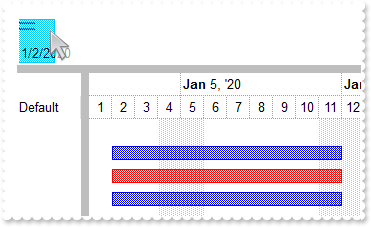
OleObject oG2antt,var_Bar,var_Chart,var_Items
any h

oG2antt = ole_1.Object
oG2antt.BeginUpdate()
oG2antt.Columns.Add("Default")
oG2antt.Background(18,RGB(190,190,190))
oG2antt.BackColorLevelHeader = oG2antt.BackColor
var_Chart = oG2antt.Chart
	var_Chart.LevelCount = 2
	var_Chart.PaneWidth(false,64)
	var_Chart.OverviewHeight = 48
	var_Chart.OverviewVisible = 73730 /*exOverviewSplitter | exOverviewShowMargins | exOverviewShowAllVisible*/
	var_Chart.FirstVisibleDate = 2020-01-01
	var_Bar = var_Chart.Bars.Copy("Task","TaskO")
		var_Bar.OverviewColor = -1
		var_Bar.Color = RGB(255,0,0)
var_Items = oG2antt.Items
	var_Items.AddItem("")
	h = var_Items.AddItem("")
	var_Items.AddBar(h,"Task",2020-01-02,2020-01-12,"K1")
	var_Items.AddBar(h,"Task",2020-12-02,2020-12-12,"K2")
	h = var_Items.AddItem("")
	var_Items.AddBar(h,"TaskO",2020-01-02,2020-01-12,"K1")
	var_Items.AddBar(h,"TaskO",2020-12-02,2020-12-12,"K2")
	h = var_Items.AddItem("")
	var_Items.AddBar(h,"Task",2020-01-02,2020-01-12,"K1")
	var_Items.AddBar(h,"Task",2020-12-02,2020-12-12,"K2")
oG2antt.EndUpdate()
|
|
2144
|
Is it possible to exclude the parent/child items when do the filtering, so to include only items that match the filter without any indentation
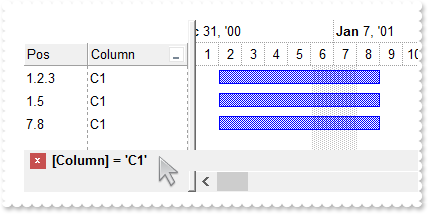
/*begin event AddItem(long  Item) - Occurs after a new Item has been inserted to Items collection.*/
/*
	oG2antt = ole_1.Object
	oG2antt.Items.AddBar(Item,"Task",2001-01-02,2001-01-09)
*/
/*end event AddItem*/

/*begin event FilterChange() - Occurs when the filter was changed.*/
/*
	oG2antt = ole_1.Object
	oG2antt.Indent = oG2antt.FormatABC("value > 0 ? 18 : 0",.Items.MatchItemCount)
*/
/*end event FilterChange*/

OleObject oG2antt,var_Chart,var_Column,var_Column1,var_Columns,var_Items
any h,h2

oG2antt = ole_1.Object
oG2antt.BeginUpdate()
oG2antt.LinesAtRoot = -1
oG2antt.Indent = 18
oG2antt.FilterInclude = 4
oG2antt.DrawGridLines = 2
oG2antt.HeaderAppearance = 1
var_Chart = oG2antt.Chart
	var_Chart.LevelCount = 2
	var_Chart.FirstVisibleDate = 2001-01-01
	var_Chart.PaneWidth(false,164)
var_Columns = oG2antt.Columns
	var_Column = var_Columns.Add("Column")
		var_Column.DisplayFilterButton = true
		var_Column.FilterType = 240
		var_Column.FilterList = 256
		var_Column.Filter = "C1"
	var_Column1 = var_Columns.Add("Pos")
		var_Column1.FormatColumn = "1 rindex ``"
		var_Column1.Position = 0
		var_Column1.AllowSizing = false
		var_Column1.AllowDragging = false
var_Items = oG2antt.Items
	h = var_Items.AddItem("R1")
	h2 = var_Items.InsertItem(h,,"S")
	var_Items.InsertItem(h2,,"C1")
	var_Items.InsertItem(h2,,"C2")
	var_Items.InsertItem(h,,"C1")
	var_Items.InsertItem(h,,"C2")
	var_Items.ExpandItem(h,true)
	h = var_Items.AddItem("R2")
	var_Items.InsertItem(h,,"C1")
	var_Items.InsertItem(h,,"C2")
oG2antt.ApplyFilter()
oG2antt.EndUpdate()
|
|
2143
|
I am using the Chart.AllowResizeChart property. How can I customize the labels into the chart's levels
OleObject oG2antt,var_Chart,var_Items

oG2antt = ole_1.Object
oG2antt.BeginUpdate()
oG2antt.Columns.Add("Task")
var_Chart = oG2antt.Chart
	var_Chart.AllowResizeChart = 262 /*exAllowChangeUnitScale | exAllowResizeChartMiddle | exAllowResizeChartHeader*/
	var_Chart.Label(0,"year")
	var_Chart.Label(1,"")
	var_Chart.Label(2,"")
	var_Chart.Label(16,"month")
	var_Chart.Label(17,"")
	var_Chart.Label(256,"week")
	var_Chart.Label(4096,"day")
	var_Chart.Label(65536,"hour")
	var_Chart.Label(1048576,"")
	var_Chart.Label(16777216,"")
	var_Chart.ShowNonworkingDates = false
	var_Chart.LevelCount = 2
	var_Chart.FirstVisibleDate = 2001-01-01
	var_Chart.PaneWidth(false,48)
	var_Chart.UnitWidth = 32
	var_Chart.UnitScale = 4096
var_Items = oG2antt.Items
	var_Items.AddBar(var_Items.AddItem("Task A"),"Task",2001-01-02,2001-01-06,"K1")
	var_Items.AddBar(var_Items.AddItem("Task B"),"Task",2001-01-06,2001-01-10,"K1")
	var_Items.AddBar(var_Items.AddItem("Task C"),"Task",2001-01-10,2001-01-14,"K1")
	var_Items.AddBar(var_Items.AddItem(""),"",2001-01-08,2001-01-08,"Info","Click the <b>middle</b> mouse button and start dragging")
oG2antt.EndUpdate()
|
|
2142
|
Is it possible to display the header using multiple lines, while chart display multiple levels (sample 2)
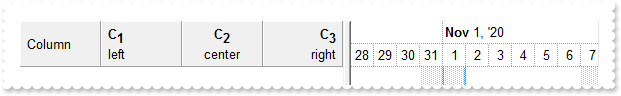
/*begin event AddColumn(oleobject  Column) - Fired after a new column has been added.*/
/*
	Column.Def(52) = 4
	Column.Def(53) = 4
	oG2antt = ole_1.Object
*/
/*end event AddColumn*/

OleObject oG2antt,var_Chart,var_Columns

oG2antt = ole_1.Object
oG2antt.BeginUpdate()
var_Chart = oG2antt.Chart
	var_Chart.LevelCount = 2
	var_Chart.PaneWidth(true,256)
oG2antt.HeaderVisible = 1
oG2antt.HeaderAppearance = 1
var_Columns = oG2antt.Columns
	var_Columns.Add("Column")
	var_Columns.Add("C1").HTMLCaption = "<b>C<off 4>1</b><br>left"
	var_Columns.Add("C2").HTMLCaption = "<c><b>C<off 4>2</b><br><c>center"
	var_Columns.Add("C3").HTMLCaption = "<r><b>C<off 4>3</b><br><r>right"
oG2antt.EndUpdate()
|
|
2141
|
Is there any way to control the z-order of a TimeZone
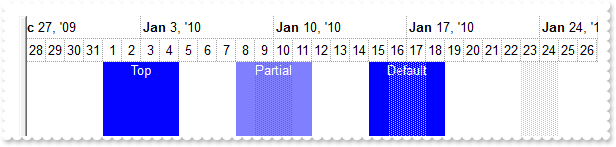
OleObject oG2antt,var_Chart

oG2antt = ole_1.Object
var_Chart = oG2antt.Chart
	var_Chart.PaneWidth(false,0)
	var_Chart.UnitWidth = 15
	var_Chart.LevelCount = 2
	var_Chart.FirstVisibleDate = 2009-12-28
	var_Chart.MarkTimeZone("Top",2010-01-01,2010-01-05,16711680,"1;;<fgcolor=FFFFFF>Top;1")
	var_Chart.MarkTimeZone("Partial",2010-01-08,2010-01-12,16711680,"50;;<fgcolor=FFFFFF>Partial;1")
	var_Chart.MarkTimeZone("Default",2010-01-15,2010-01-19,16711680,";;<fgcolor=FFFFFF>Default;1")
|
|
2140
|
Is it possible to display the header using multiple lines, while chart display multiple levels (sample 1)
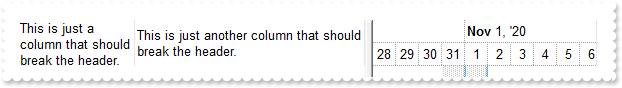
OleObject oG2antt

oG2antt = ole_1.Object
oG2antt.BeginUpdate()
oG2antt.Chart.LevelCount = 2
oG2antt.HeaderHeight = 18
oG2antt.HeaderSingleLine = false
oG2antt.HeaderVisible = 1
oG2antt.Columns.Add("This is just a column that should break the header.").Width = 32
oG2antt.Columns.Add("This is just another column that should break the header.")
oG2antt.EndUpdate()
|
|
2139
|
Difference between HistogramValueFromPoint and HistogramValue (sample 2)
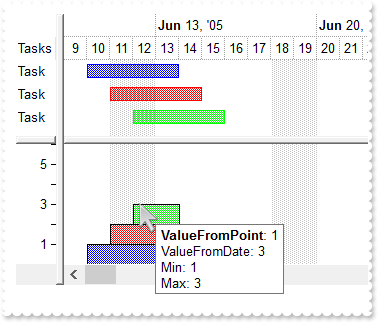
/*begin event MouseMove(integer  Button, integer  Shift, long  X, long  Y) - Occurs when the user moves the mouse.*/
/*
	OleObject var_Chart
	any format,v1,v2,vMax,vMin
	oG2antt = ole_1.Object
	var_Chart = oG2antt.Chart
		v1 = var_Chart.HistogramValueFromPoint(-1,-1)
		v2 = var_Chart.HistogramValue(var_Chart.DateFromPoint(-1,-1))
		vMin = var_Chart.HistogramValue("min")
		vMax = var_Chart.HistogramValue("max")
	format = oG2antt.FormatABC("`<b>ValueFromPoint</b>: ` + A + `<br>ValueFromDate: ` + B",v1,v2)
	format = oG2antt.FormatABC("A  + `<br>Min: ` + B + `<br>Max: ` + C",format,vMin,vMax)
	oG2antt.ShowToolTip(String(format),,,"16","16")
*/
/*end event MouseMove*/

OleObject oG2antt,var_Bar,var_Chart,var_Items

oG2antt = ole_1.Object
oG2antt.BeginUpdate()
oG2antt.Columns.Add("Tasks")
var_Chart = oG2antt.Chart
	var_Chart.FirstWeekDay = 1
	var_Chart.LevelCount = 2
	var_Chart.PaneWidth(false,40)
	var_Chart.FirstVisibleDate = 2005-06-09
	var_Chart.HistogramVisible = true
	var_Chart.HistogramView = 8304 /*exHistogramGroupCumulative | exHistogramAllItems*/
	var_Chart.HistogramHeight = 128
	var_Bar = var_Chart.Bars.Item("Task")
		var_Bar.HistogramPattern = var_Bar.Pattern
		var_Bar.HistogramType = 256
		var_Bar.HistogramItems = -6
		var_Bar.HistogramRulerLinesColor = RGB(0,0,1)
		var_Bar.HistogramBorderSize = 1
		var_Bar.HistogramBorderColor = RGB(0,0,1)
		var_Bar.HistogramCumulativeOriginalColorBars = 0
		var_Bar.HistogramCumulativeShowLegend = -1
var_Items = oG2antt.Items
	var_Items.AddBar(var_Items.AddItem("Task"),"Task",2005-06-10,2005-06-14,"")
	var_Items.AddBar(var_Items.AddItem("Task"),"Task",2005-06-11,2005-06-15,"")
	var_Items.AddBar(var_Items.AddItem("Task"),"Task",2005-06-12,2005-06-16,"")
oG2antt.EndUpdate()
|
|
2138
|
Difference between HistogramValueFromPoint and HistogramValue (sample 1)
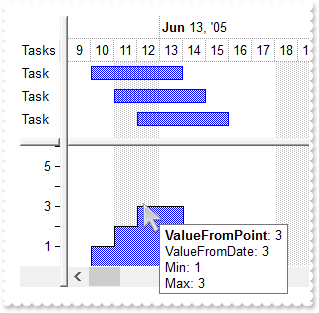
/*begin event MouseMove(integer  Button, integer  Shift, long  X, long  Y) - Occurs when the user moves the mouse.*/
/*
	OleObject var_Chart
	any format,v1,v2,vMax,vMin
	oG2antt = ole_1.Object
	var_Chart = oG2antt.Chart
		v1 = var_Chart.HistogramValueFromPoint(-1,-1)
		v2 = var_Chart.HistogramValue(var_Chart.DateFromPoint(-1,-1))
		vMin = var_Chart.HistogramValue("min")
		vMax = var_Chart.HistogramValue("max")
	format = oG2antt.FormatABC("`<b>ValueFromPoint</b>: ` + A + `<br>ValueFromDate: ` + B",v1,v2)
	format = oG2antt.FormatABC("A  + `<br>Min: ` + B + `<br>Max: ` + C",format,vMin,vMax)
	oG2antt.ShowToolTip(String(format),,,"16","16")
*/
/*end event MouseMove*/

OleObject oG2antt,var_Bar,var_Chart,var_Items

oG2antt = ole_1.Object
oG2antt.BeginUpdate()
oG2antt.Columns.Add("Tasks")
var_Chart = oG2antt.Chart
	var_Chart.FirstWeekDay = 1
	var_Chart.LevelCount = 2
	var_Chart.PaneWidth(false,40)
	var_Chart.FirstVisibleDate = 2005-06-09
	var_Chart.HistogramVisible = true
	var_Chart.HistogramView = 112
	var_Chart.HistogramHeight = 128
	var_Bar = var_Chart.Bars.Item("Task")
		var_Bar.HistogramPattern = var_Bar.Pattern
		var_Bar.HistogramType = 0
		var_Bar.HistogramItems = -6
		var_Bar.HistogramRulerLinesColor = RGB(0,0,1)
		var_Bar.HistogramBorderSize = 1
		var_Bar.HistogramBorderColor = RGB(0,0,1)
var_Items = oG2antt.Items
	var_Items.AddBar(var_Items.AddItem("Task"),"Task",2005-06-10,2005-06-14,"")
	var_Items.AddBar(var_Items.AddItem("Task"),"Task",2005-06-11,2005-06-15,"")
	var_Items.AddBar(var_Items.AddItem("Task"),"Task",2005-06-12,2005-06-16,"")
oG2antt.EndUpdate()
|
|
2137
|
I am using the Inside-Zoom feature, but the inside grid lines are more dashed the dotted
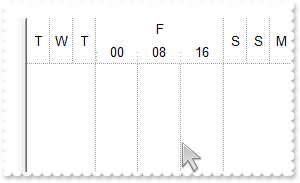
OleObject oG2antt,var_Chart,var_InsideZoomFormat,var_InsideZooms

oG2antt = ole_1.Object
oG2antt.BeginUpdate()
var_Chart = oG2antt.Chart
	var_Chart.UnitScale = 4096
	var_Chart.PaneWidth(false,0)
	var_Chart.LevelCount = 2
	var_Chart.FirstVisibleDate = 2008-01-01
	var_InsideZoomFormat = var_Chart.DefaultInsideZoomFormat
		var_InsideZoomFormat.InsideLabel = "<%hh%>"
		var_InsideZoomFormat.InsideUnit = 65536
		var_InsideZoomFormat.InsideCount = 8
		var_InsideZoomFormat.GridLineStyle = 512
	var_Chart.AllowInsideZoom = true
	var_InsideZooms = var_Chart.InsideZooms
		var_InsideZooms.Add(2008-01-04)
	var_Chart.DrawGridLines = 2
	var_Chart.ShowNonworkingDates = false
oG2antt.EndUpdate()
|
|
2136
|
I am using expressions for exBarEffort, but the histogram does not show correctly the data
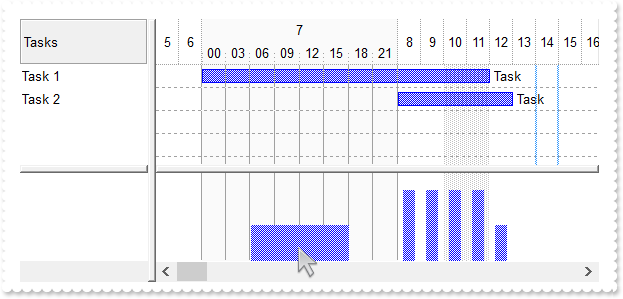
OleObject oG2antt,var_Bar,var_Chart,var_InsideZoom,var_Items

oG2antt = ole_1.Object
oG2antt.BeginUpdate()
oG2antt.HeaderVisible = 1
oG2antt.HeaderAppearance = 4
var_Chart = oG2antt.Chart
	var_Chart.FirstVisibleDate = 2020-10-05
	var_Chart.PaneWidth(false,128)
	var_Chart.LevelCount = 2
	var_Chart.HistogramHeight = 96
	var_Chart.HistogramVisible = true
	var_Chart.AllowInsideZoom = true
	var_Chart.DrawGridLines = -1
	var_InsideZoom = var_Chart.InsideZooms.Add(2020-10-07)
		var_InsideZoom.Width = 196
	var_Chart.DefaultInsideZoomFormat.GridLineStyle = 48
	var_Bar = var_Chart.Bars.Item("Task")
		var_Bar.HistogramPattern = var_Bar.Pattern
		var_Bar.Def(3,"<%=%0%>")
		var_Bar.Def(4,18)
		var_Bar.Def(21,"(hour(value) > 5 and hour(value) < 18) ? 2 : 0")
	var_Chart.HistogramUnitScale = 65536
oG2antt.Columns.Add("Tasks").FormatColumn = "`Task ` + (1 index ``)"
var_Items = oG2antt.Items
	var_Items.AddBar(var_Items.AddItem(""),"Task",2020-10-07,2020-10-12)
	var_Items.AddBar(var_Items.AddItem(""),"Task",2020-10-08,2020-10-13)
oG2antt.EndUpdate()
|
|
2135
|
How can I specify the z-order of bars to be shown within the chart's histogram
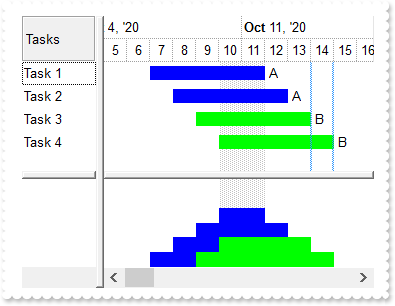
OleObject oG2antt,var_Bar,var_Bar1,var_Chart,var_Items

oG2antt = ole_1.Object
oG2antt.BeginUpdate()
oG2antt.HeaderVisible = 1
oG2antt.HeaderAppearance = 4
var_Chart = oG2antt.Chart
	var_Chart.FirstVisibleDate = 2020-10-05
	var_Chart.PaneWidth(false,128)
	var_Chart.LevelCount = 2
	var_Chart.HistogramHeight = 96
	var_Chart.HistogramVisible = true
	var_Bar = var_Chart.Bars.Add("A")
		var_Bar.Color = RGB(0,0,255)
		var_Bar.HistogramPattern = 1
		var_Bar.HistogramItems = -6
		var_Bar.HistogramCumulativeOriginalColorBars = 1
		var_Bar.Def(3,"<%=%0%>")
		var_Bar.Def(4,18)
	var_Bar1 = var_Chart.Bars.Copy("A","B")
		var_Bar1.Color = RGB(0,255,0)
		var_Bar1.HistogramCumulativeOriginalColorBars = 1
		var_Bar1.Def(3,"<%=%0%>")
		var_Bar1.Def(4,18)
	var_Chart.HistogramView = 8304 /*exHistogramGroupCumulative | exHistogramAllItems*/
	var_Chart.HistogramZOrder = "A,B"
oG2antt.Columns.Add("Tasks").FormatColumn = "`Task ` + (1 index ``)"
var_Items = oG2antt.Items
	var_Items.AddBar(var_Items.AddItem(""),"A",2020-10-07,2020-10-12)
	var_Items.AddBar(var_Items.AddItem(""),"A",2020-10-08,2020-10-13)
	var_Items.AddBar(var_Items.AddItem(""),"B",2020-10-09,2020-10-14)
	var_Items.AddBar(var_Items.AddItem(""),"B",2020-10-10,2020-10-15)
oG2antt.EndUpdate()
|
|
2134
|
How can I show cumulative histogram for two or more different types of bars
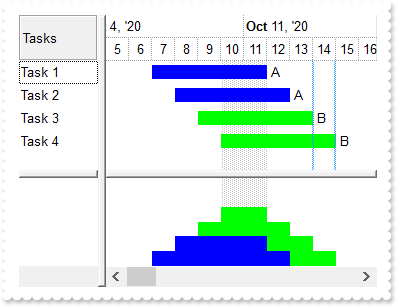
OleObject oG2antt,var_Bar,var_Bar1,var_Chart,var_Items

oG2antt = ole_1.Object
oG2antt.BeginUpdate()
oG2antt.HeaderVisible = 1
oG2antt.HeaderAppearance = 4
var_Chart = oG2antt.Chart
	var_Chart.FirstVisibleDate = 2020-10-05
	var_Chart.PaneWidth(false,128)
	var_Chart.LevelCount = 2
	var_Chart.HistogramHeight = 96
	var_Chart.HistogramVisible = true
	var_Bar = var_Chart.Bars.Add("A")
		var_Bar.Color = RGB(0,0,255)
		var_Bar.HistogramPattern = 1
		var_Bar.HistogramItems = -6
		var_Bar.HistogramCumulativeOriginalColorBars = 1
		var_Bar.Def(3,"<%=%0%>")
		var_Bar.Def(4,18)
	var_Bar1 = var_Chart.Bars.Copy("A","B")
		var_Bar1.Color = RGB(0,255,0)
		var_Bar1.HistogramCumulativeOriginalColorBars = 1
		var_Bar1.Def(3,"<%=%0%>")
		var_Bar1.Def(4,18)
	var_Chart.HistogramView = 8304 /*exHistogramGroupCumulative | exHistogramAllItems*/
oG2antt.Columns.Add("Tasks").FormatColumn = "`Task ` + (1 index ``)"
var_Items = oG2antt.Items
	var_Items.AddBar(var_Items.AddItem(""),"A",2020-10-07,2020-10-12)
	var_Items.AddBar(var_Items.AddItem(""),"A",2020-10-08,2020-10-13)
	var_Items.AddBar(var_Items.AddItem(""),"B",2020-10-09,2020-10-14)
	var_Items.AddBar(var_Items.AddItem(""),"B",2020-10-10,2020-10-15)
oG2antt.EndUpdate()
|
|
2133
|
I would like to display a solid line between "root" items, and dotted lines (default) between child items. How can I do that
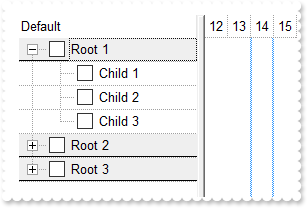
OleObject oG2antt,var_Column,var_Column1,var_ConditionalFormat,var_Items
any h

oG2antt = ole_1.Object
oG2antt.BeginUpdate()
oG2antt.LinesAtRoot = -1
oG2antt.DrawGridLines = 1
oG2antt.GridLineStyle = 512
oG2antt.VisualAppearance.Add(1,"gBFLBCJwBAEHhEJAAEhABMsIQAAYAQGKIcBiAKBQAGaAoDgYN4MAANAwjJBMKgBBCLIxhEYobgmGIXRpFMbxAKQahLEiTIgGUYJHgmK4tQLHb7zGAABRDDSOIDnGQJXhaI4JQSMMQDGLAZxVFiPRhAWLpBh+PQATrOdLUfSjVwhBKAQEBA==")
var_Column = oG2antt.Columns.Add("Default")
	var_Column.Def(0,true)
	var_Column.PartialCheck = true
var_Column1 = oG2antt.Columns.Add("Position")
	var_Column1.FormatColumn = "((1 rindex ``) contains `.`) = 0"
	var_Column1.Visible = false
var_ConditionalFormat = oG2antt.ConditionalFormats.Add("%C1")
	var_ConditionalFormat.BackColor = 31514848 /*0x1e0e0e0*/
var_Items = oG2antt.Items
	h = var_Items.AddItem("Root 1")
	var_Items.InsertItem(h,,"Child 1")
	var_Items.InsertItem(h,,"Child 2")
	var_Items.InsertItem(h,,"Child 3")
	var_Items.ExpandItem(h,true)
	h = var_Items.AddItem("Root 2")
	var_Items.InsertItem(h,,"Child 1")
	var_Items.InsertItem(h,,"Child 2")
	h = var_Items.AddItem("Root 3")
	var_Items.InsertItem(h,,"Child 1")
	var_Items.InsertItem(h,,"Child 2")
oG2antt.EndUpdate()
|
|
2132
|
I can not center or align the cell's caption and icon, when it displays the hierarchy
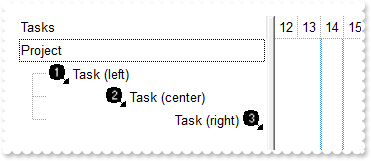
OleObject oG2antt,var_Column,var_Items
any h,hChild

oG2antt = ole_1.Object
oG2antt.BeginUpdate()
oG2antt.Images("gBJJgBAIDAAGAAEAAQhYAf8Pf4hh0QihCJo2AEZjQAjEZFEaIEaEEaAIAkcbk0olUrlktl0vmExmUzmk1m03nE5nU7nk9n0/oFBoVDolFo1HpFJpVLplNp1PqFRqVTqlVq1XrFZrVbrldr1fsFhsVjslls1ntFptVrtltt1vuFxuVzul1u13vF5vV7vl9v1/wGBwWDwmFw2HxGJxWLxmNx0xiFdyOTh8Tf9ZymXx+QytcyNgz8r0OblWjyWds+m0ka1Vf1ta1+r1mos2xrG2xeZ0+a0W0qOx3GO4NV3WeyvD2XJ5XL5nN51aiw+lfSj0gkUkAEllHanHI5j/cHg8EZf7w8vl8j4f/qfEZeB09/vjLAB30+kZQAP/P5/H6/yNAOAEAwCjMBwFAEDwJBMDwLBYAP2/8Hv8/gAGAD8LQs9w/nhDY/oygIA=")
var_Column = oG2antt.Columns.Add("Tasks")
	var_Column.Def(17,1)
oG2antt.HeaderVisible = 1
var_Items = oG2antt.Items
	h = var_Items.AddItem("Project")
	hChild = var_Items.InsertItem(h,,"<img>1</img> Task (left)")
	hChild = var_Items.InsertItem(h,,"<c><img>2</img> Task (center)")
	hChild = var_Items.InsertItem(h,,"<r>Task (right) <img>3</img>")
	var_Items.ExpandItem(h,true)
oG2antt.EndUpdate()
|
|
2131
|
How do I mask for float/integer number
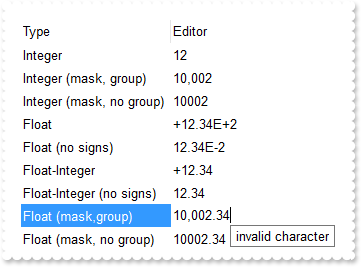
OleObject oG2antt,var_Editor,var_Editor1,var_Editor2,var_Editor3,var_Editor4,var_Editor5,var_Editor6,var_Editor7,var_Editor8,var_Items
any h

oG2antt = ole_1.Object
oG2antt.BeginUpdate()
oG2antt.ColumnAutoResize = true
oG2antt.Columns.Add("Type").Width = 32
oG2antt.Columns.Add("Editor")
var_Items = oG2antt.Items
	h = var_Items.AddItem("Integer")
	var_Items.CellValue(h,1,"12")
	var_Editor = var_Items.CellEditor(h,1)
		var_Editor.EditType = 1
		var_Editor.Numeric = -1
	h = var_Items.AddItem("Integer (mask, group)")
	var_Items.CellValue(h,1,"10002")
	var_Items.FormatCell(h,1,"value format `0||`")
	var_Editor1 = var_Items.CellEditor(h,1)
		var_Editor1.EditType = 8
		var_Editor1.Mask = ";;;float,digits=0,invalid=empty,warning=invalid character"
	h = var_Items.AddItem("Integer (mask, no group)")
	var_Items.CellValue(h,1,"10002")
	var_Items.FormatCell(h,1,"value format `0|0|`")
	var_Editor2 = var_Items.CellEditor(h,1)
		var_Editor2.EditType = 8
		var_Editor2.Mask = ";;;float,digits=0,grouping=,invalid=empty,warning=invalid character"
	h = var_Items.AddItem("Float")
	var_Items.CellValue(h,1,"+12.34E+2")
	var_Editor3 = var_Items.CellEditor(h,1)
		var_Editor3.EditType = 1
		var_Editor3.Numeric = 1
	h = var_Items.AddItem("Float (no signs)")
	var_Items.CellValue(h,1,"12.34E-2")
	var_Editor4 = var_Items.CellEditor(h,1)
		var_Editor4.EditType = 1
		var_Editor4.Numeric = 769 /*exDisableSigns | exFloat*/
	h = var_Items.AddItem("Float-Integer")
	var_Items.CellValue(h,1,"+12.34")
	var_Editor5 = var_Items.CellEditor(h,1)
		var_Editor5.EditType = 1
		var_Editor5.Numeric = 2
	h = var_Items.AddItem("Float-Integer (no signs)")
	var_Items.CellValue(h,1,"12.34")
	var_Editor6 = var_Items.CellEditor(h,1)
		var_Editor6.EditType = 1
		var_Editor6.Numeric = 770 /*exDisableSigns | exFloatInteger*/
	h = var_Items.AddItem("Float (mask,group)")
	var_Items.CellValue(h,1,"10002.34")
	var_Items.FormatCell(h,1,"value format `2`")
	var_Editor7 = var_Items.CellEditor(h,1)
		var_Editor7.EditType = 8
		var_Editor7.Mask = ";;;float,invalid=empty,warning=invalid character"
	h = var_Items.AddItem("Float (mask, no group)")
	var_Items.CellValue(h,1,"10002.34")
	var_Items.FormatCell(h,1,"value format `2|0|`")
	var_Editor8 = var_Items.CellEditor(h,1)
		var_Editor8.EditType = 8
		var_Editor8.Mask = ";;;float,grouping=,invalid=empty,warning=invalid character"
oG2antt.EndUpdate()
|
|
2130
|
Is it possible to offset (horizontally) the bar's caption
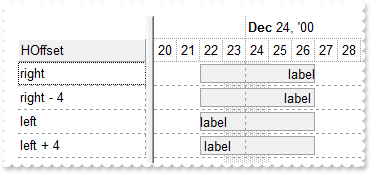
OleObject oG2antt,var_Bar,var_Chart,var_Items
any h

oG2antt = ole_1.Object
oG2antt.BeginUpdate()
oG2antt.Columns.Add("HOffset")
oG2antt.HeaderAppearance = 1
oG2antt.ScrollBySingleLine = true
oG2antt.DrawGridLines = -2
var_Chart = oG2antt.Chart
	var_Chart.DrawGridLines = -2
	var_Chart.FirstVisibleDate = 2000-12-16
	var_Chart.LevelCount = 2
	var_Chart.PaneWidth(false,128)
	var_Bar = var_Chart.Bars.Item("Task")
		var_Bar.Pattern = 32
		var_Bar.Color = RGB(164,164,164)
		var_Bar.StartColor = RGB(240,240,240)
		var_Bar.EndColor = var_Bar.StartColor
		var_Bar.Height = 15
		var_Bar.Def(3,"label")
var_Items = oG2antt.Items
	h = var_Items.AddItem("right")
	var_Items.AddBar(h,"Task",2000-12-22,2000-12-27)
	var_Items.ItemBar(h,"",4,2)
	h = var_Items.AddItem("right - 4")
	var_Items.AddBar(h,"Task",2000-12-22,2000-12-27)
	var_Items.ItemBar(h,"",4,2)
	var_Items.ItemBar(h,"",58,-4)
	h = var_Items.AddItem("left")
	var_Items.AddBar(h,"Task",2000-12-22,2000-12-27)
	var_Items.ItemBar(h,"",4,0)
	h = var_Items.AddItem("left + 4")
	var_Items.AddBar(h,"Task",2000-12-22,2000-12-27)
	var_Items.ItemBar(h,"",4,0)
	var_Items.ItemBar(h,"",58,4)
oG2antt.EndUpdate()
|
|
2129
|
Is it possible to always center the bar's caption (even if the item-bar is partially visible)
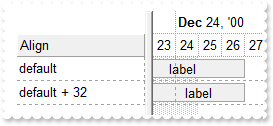
OleObject oG2antt,var_Bar,var_Chart,var_Items
any h

oG2antt = ole_1.Object
oG2antt.BeginUpdate()
oG2antt.Columns.Add("Align")
oG2antt.HeaderAppearance = 1
oG2antt.ScrollBySingleLine = true
oG2antt.DrawGridLines = -2
var_Chart = oG2antt.Chart
	var_Chart.DrawGridLines = -2
	var_Chart.FirstVisibleDate = 2000-12-23
	var_Chart.LevelCount = 2
	var_Chart.PaneWidth(false,128)
	var_Bar = var_Chart.Bars.Item("Task")
		var_Bar.Pattern = 32
		var_Bar.Color = RGB(164,164,164)
		var_Bar.StartColor = RGB(240,240,240)
		var_Bar.EndColor = var_Bar.StartColor
		var_Bar.Height = 15
var_Items = oG2antt.Items
	h = var_Items.AddItem("default")
	var_Items.AddBar(h,"Task",2000-12-22,2000-12-27,"","label")
	var_Items.ItemBar(h,"",4,1)
	h = var_Items.AddItem("default + 32")
	var_Items.AddBar(h,"Task",2000-12-22,2000-12-27,"","label")
	var_Items.ItemBar(h,"",4,33)
oG2antt.EndUpdate()
|
|
2128
|
How do I set an extra data for each item
/*begin event MouseMove(integer  Button, integer  Shift, long  X, long  Y) - Occurs when the user moves the mouse.*/
/*
	any i
	oG2antt = ole_1.Object
	i = oG2antt.ItemFromPoint(-1,-1,c,hit)
	MessageBox("Information",string( String(i) ))
	MessageBox("Information",string( String(oG2antt.Items.ItemData(i)) ))
*/
/*end event MouseMove*/

OleObject oG2antt,var_Items,var_Items1

oG2antt = ole_1.Object
oG2antt.BeginUpdate()
oG2antt.ColumnAutoResize = true
oG2antt.Columns.Add("Default")
var_Items = oG2antt.Items
	var_Items.ItemData(var_Items.AddItem("method 1"),"your extra data of method 1")
	var_Items.InsertItem(0,"your extra data of method 2","method 2")
var_Items1 = oG2antt.Items
	var_Items1.DefaultItem = var_Items1.AddItem("method 3")
	var_Items1.ItemData(0,"your extra data of method 3")
oG2antt.EndUpdate()
|
|
2127
|
Is it possible to show the position of rows the into the chart section
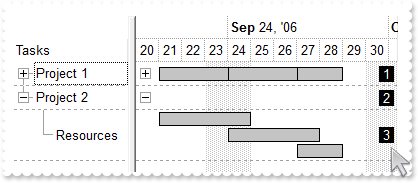
/*begin event BeforeExpandItem(long  Item, any  Cancel) - Fired before an item is about to be expanded (collapsed).*/
/*
	oG2antt = ole_1.Object
	oG2antt.Refresh()
*/
/*end event BeforeExpandItem*/

OleObject oG2antt,var_Bar,var_Chart,var_Column,var_Items
any h,h1

oG2antt = ole_1.Object
oG2antt.BeginUpdate()
oG2antt.Indent = 16
oG2antt.LinesAtRoot = -1
oG2antt.HasLines = 1
oG2antt.DrawGridLines = 1
oG2antt.ScrollBySingleLine = true
oG2antt.FullRowSelect = 0
oG2antt.Columns.Add("Tasks")
var_Column = oG2antt.Columns.Add("Pos")
	var_Column.Visible = false
	var_Column.FormatColumn = "`<r><bgcolor 000000><fgcolor FFFFFF> ` + 1 apos `` + ` </fgcolor></bgcolor>`"
	var_Column.Def(17,1)
var_Chart = oG2antt.Chart
	var_Chart.ColumnsFormatLevel = ",|,1:64"
	var_Chart.FirstVisibleDate = 2006-09-20
	var_Chart.ShowCollapsedBars = true
	var_Chart.LevelCount = 2
	var_Chart.PaneWidth(false,128)
	var_Chart.DrawGridLines = 1
	var_Bar = var_Chart.Bars.Item("Task")
		var_Bar.OverlaidType = 3
		var_Bar.Color = RGB(0,0,0)
		var_Bar.StartColor = RGB(196,196,196)
		var_Bar.EndColor = RGB(196,196,196)
		var_Bar.Pattern = 32
var_Items = oG2antt.Items
	h = var_Items.AddItem("Project 1")
	h1 = var_Items.InsertItem(h,,"Resources")
	var_Items.AddBar(h1,"Task",2006-09-21,2006-09-25,"A")
	var_Items.AddBar(h1,"Task",2006-09-24,2006-09-28,"B")
	var_Items.AddBar(h1,"Task",2006-09-27,2006-09-29,"C")
	h = var_Items.AddItem("Project 2")
	h1 = var_Items.InsertItem(h,,"Resources")
	var_Items.AddBar(h1,"Task",2006-09-21,2006-09-25,"A")
	var_Items.AddBar(h1,"Task",2006-09-24,2006-09-28,"B")
	var_Items.AddBar(h1,"Task",2006-09-27,2006-09-29,"C")
	var_Items.ExpandItem(h,true)
oG2antt.EndUpdate()
|
|
2126
|
I do not like to specify the item padding for every column I add. The question is how can I do it automatically
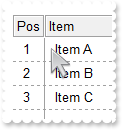
OleObject oG2antt,var_Column,var_Columns,var_Items

oG2antt = ole_1.Object
oG2antt.BeginUpdate()
oG2antt.AttachTemplate("handle AddColumn(Column){Column{Def(48)=8;Def(49)=8;AllowDragging=False;AllowSizing = True}}")
oG2antt.HeaderAppearance = 4
oG2antt.DrawGridLines = -1
oG2antt.GridLineStyle = 32
var_Columns = oG2antt.Columns
	var_Columns.Add("Item")
	var_Column = var_Columns.Add("Pos")
		var_Column.Position = 0
		var_Column.Width = 32
		var_Column.AllowSizing = false
		var_Column.FormatColumn = "1 index ``"
var_Items = oG2antt.Items
	var_Items.AddItem("Item A")
	var_Items.AddItem("Item B")
	var_Items.AddItem("Item C")
oG2antt.EndUpdate()
|
|
2125
|
Stack vs Cascade
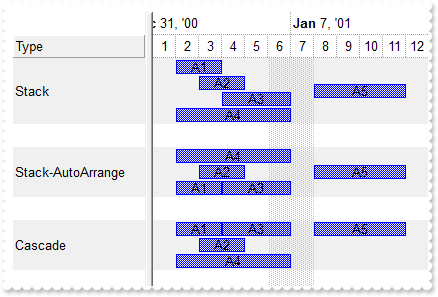
OleObject oG2antt,var_Chart,var_Items
any h

oG2antt = ole_1.Object
oG2antt.BeginUpdate()
oG2antt.ScrollBySingleLine = true
oG2antt.HeaderAppearance = 1
oG2antt.Columns.Add("Type")
oG2antt.BackColorAlternate = RGB(240,240,240)
var_Chart = oG2antt.Chart
	var_Chart.LevelCount = 2
	var_Chart.AllowCreateBar = 1
	var_Chart.AllowLinkBars = false
	var_Chart.ResizeUnitScale = 65536
	var_Chart.PaneWidth(false,128)
	var_Chart.FirstVisibleDate = 2001-01-01
	var_Chart.Bars.Copy("Task","Stack").OverlaidType = 3
	var_Chart.Bars.Copy("Task","AStack").OverlaidType = 515 /*exOverlaidBarsStackAutoArrange | exOverlaidBarsStack*/
	var_Chart.Bars.Copy("Task","Cascade").OverlaidType = 4
var_Items = oG2antt.Items
	h = var_Items.AddItem("Stack")
	var_Items.AddBar(h,"Stack",2001-01-02,2001-01-04,"A1")
	var_Items.AddBar(h,"Stack",2001-01-03,2001-01-05,"A2")
	var_Items.AddBar(h,"Stack",2001-01-04,2001-01-07,"A3")
	var_Items.AddBar(h,"Stack",2001-01-02,2001-01-07,"A4")
	var_Items.AddBar(h,"Stack",2001-01-08,2001-01-12,"A5")
	var_Items.AddItem()
	h = var_Items.AddItem("Stack-AutoArrange")
	var_Items.AddBar(h,"AStack",2001-01-02,2001-01-04,"A1")
	var_Items.AddBar(h,"AStack",2001-01-03,2001-01-05,"A2")
	var_Items.AddBar(h,"AStack",2001-01-04,2001-01-07,"A3")
	var_Items.AddBar(h,"AStack",2001-01-02,2001-01-07,"A4")
	var_Items.AddBar(h,"AStack",2001-01-08,2001-01-12,"A5")
	var_Items.AddItem()
	h = var_Items.AddItem("Cascade")
	var_Items.AddBar(h,"Cascade",2001-01-02,2001-01-04,"A1")
	var_Items.AddBar(h,"Cascade",2001-01-03,2001-01-05,"A2")
	var_Items.AddBar(h,"Cascade",2001-01-04,2001-01-07,"A3")
	var_Items.AddBar(h,"Cascade",2001-01-02,2001-01-07,"A4")
	var_Items.AddBar(h,"Cascade",2001-01-08,2001-01-12,"A5")
	var_Items.AddItem()
	var_Items.ItemBar(0,"<*>",3,"<%=%9%>")
oG2antt.EndUpdate()
|
|
2124
|
How can I change the Exclude field in the drop down filter window
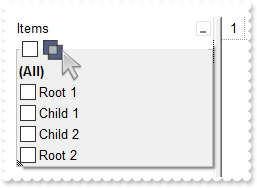
OleObject oG2antt,var_Column,var_Items
any h

oG2antt = ole_1.Object
oG2antt.BeginUpdate()
oG2antt.LinesAtRoot = -1
oG2antt.HTMLPicture("exclude","gCJKBOI4NBQaBQAhQNJJIIhShQACERCAEAcRdrdcUQhQDOZCJJUBEjbbhJ7giIJOBILJziJvl4BeKibhDiIZOhFLB0KZvMx0O5hORlAB3owuNJuNZzMZhOBlFxvORnTbuHgaiIeKBMKhFf9fDIcEoPCAVEAlGI4HhBBYMCARCQVGg4IhVMCAWC2XY1Q7WJ8RBB0KROKYAYDBbzicjndD6fA/VsRHRJIhBkRbMYIGwGAQjA2fRYOEBoYjBFBx1ATCgCGQ8M7OTjSaJMDRDKIwYu5DrIMBgSAADKJTqhBhyRApAA3FAucZPPilokRJJFJxEVxCMCCgIA==")
oG2antt.Description(25,"<img>exclude</img>")
var_Column = oG2antt.Columns.Add("Items")
	var_Column.DisplayFilterButton = true
	var_Column.DisplayFilterPattern = false
	var_Column.FilterList = 9472 /*exShowExclude | exShowFocusItem | exShowCheckBox*/
var_Items = oG2antt.Items
	h = var_Items.AddItem("Root 1")
	var_Items.InsertItem(h,,"Child 1")
	var_Items.InsertItem(h,,"Child 2")
	var_Items.ExpandItem(h,true)
	h = var_Items.AddItem("Root 2")
	var_Items.InsertItem(h,,"Child 1")
oG2antt.EndUpdate()
|
|
2123
|
How can I change the Exclude field in the drop down filter window
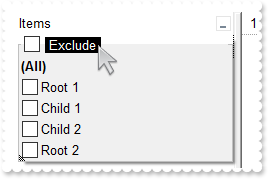
OleObject oG2antt,var_Column,var_Items
any h

oG2antt = ole_1.Object
oG2antt.BeginUpdate()
oG2antt.LinesAtRoot = -1
oG2antt.Description(25,"<bgcolor 0><fgcolor ffffff> Exclude </fgcolor></bgcolor>")
var_Column = oG2antt.Columns.Add("Items")
	var_Column.DisplayFilterButton = true
	var_Column.DisplayFilterPattern = false
	var_Column.FilterList = 9472 /*exShowExclude | exShowFocusItem | exShowCheckBox*/
var_Items = oG2antt.Items
	h = var_Items.AddItem("Root 1")
	var_Items.InsertItem(h,,"Child 1")
	var_Items.InsertItem(h,,"Child 2")
	var_Items.ExpandItem(h,true)
	h = var_Items.AddItem("Root 2")
	var_Items.InsertItem(h,,"Child 1")
oG2antt.EndUpdate()
|
|
2122
|
The grid lines looks different then before. What should I do
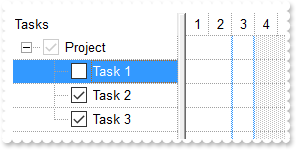
OleObject oG2antt,var_Column,var_Items
any h,hChild

oG2antt = ole_1.Object
oG2antt.BeginUpdate()
oG2antt.LinesAtRoot = -1
var_Column = oG2antt.Columns.Add("Tasks")
	var_Column.Def(0,true)
	var_Column.PartialCheck = true
oG2antt.DrawGridLines = -1
oG2antt.GridLineStyle = 512
oG2antt.Chart.DrawGridLines = oG2antt.DrawGridLines
oG2antt.Chart.GridLineStyle = oG2antt.GridLineStyle
oG2antt.HeaderVisible = 1
var_Items = oG2antt.Items
	h = var_Items.AddItem("Project")
	hChild = var_Items.InsertItem(h,,"Task 1")
	var_Items.SelectItem(hChild,true)
	hChild = var_Items.InsertItem(h,,"Task 2")
	var_Items.CellState(hChild,0,1)
	hChild = var_Items.InsertItem(h,,"Task 3")
	var_Items.CellState(hChild,0,1)
	var_Items.ExpandItem(h,true)
oG2antt.EndUpdate()
|
|
2121
|
How can I hide the task/bar's extra-caption
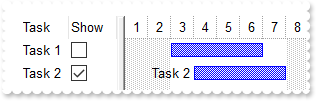
OleObject oG2antt,var_Bar,var_Chart,var_Column,var_Editor,var_Items

oG2antt = ole_1.Object
oG2antt.BeginUpdate()
var_Chart = oG2antt.Chart
	var_Chart.PaneWidth(false,96)
	var_Chart.FirstVisibleDate = 2011-01-01
	var_Bar = var_Chart.Bars.Item("Task")
		var_Bar.Def(44,"<%=%C0%>")
		var_Bar.Def(4,18)
		var_Bar.Def(45,16)
oG2antt.Columns.Add("Task")
var_Column = oG2antt.Columns.Add("Show")
	var_Editor = var_Column.Editor
		var_Editor.EditType = 19
		var_Editor.Option(17,1)
	var_Column.Def(18,57)
var_Items = oG2antt.Items
	var_Items.AllowCellValueToItemBar = true
	var_Items.AddBar(var_Items.AddItem("Task 1"),"Task",2011-01-03,2011-01-07)
	var_Items.ItemBar(var_Items.FirstVisibleItem,"",57,false)
	var_Items.AddBar(var_Items.AddItem("Task 2"),"Task",2011-01-04,2011-01-08)
oG2antt.EndUpdate()
|
|
2120
|
How can I hide the task/bar's caption
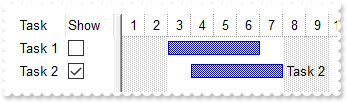
OleObject oG2antt,var_Bar,var_Chart,var_Column,var_Editor,var_Items

oG2antt = ole_1.Object
oG2antt.BeginUpdate()
var_Chart = oG2antt.Chart
	var_Chart.PaneWidth(false,96)
	var_Chart.FirstVisibleDate = 2011-01-01
	var_Bar = var_Chart.Bars.Item("Task")
		var_Bar.Def(3,"<%=%C0%>")
		var_Bar.Def(4,18)
oG2antt.Columns.Add("Task")
var_Column = oG2antt.Columns.Add("Show")
	var_Editor = var_Column.Editor
		var_Editor.EditType = 19
		var_Editor.Option(17,1)
	var_Column.Def(18,56)
var_Items = oG2antt.Items
	var_Items.AllowCellValueToItemBar = true
	var_Items.AddBar(var_Items.AddItem("Task 1"),"Task",2011-01-03,2011-01-07)
	var_Items.ItemBar(var_Items.FirstVisibleItem,"",56,false)
	var_Items.AddBar(var_Items.AddItem("Task 2"),"Task",2011-01-04,2011-01-08)
oG2antt.EndUpdate()
|
|
2119
|
Can I sort the column by check-state
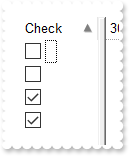
OleObject oG2antt,var_Column,var_Items

oG2antt = ole_1.Object
oG2antt.BeginUpdate()
var_Column = oG2antt.Columns.Add("Check")
	var_Column.Def(0,true)
	var_Column.SortType = 32
var_Items = oG2antt.Items
	var_Items.AddItem()
	var_Items.CellState(var_Items.AddItem(),0,1)
	var_Items.CellState(var_Items.AddItem(),0,1)
	var_Items.AddItem()
oG2antt.Columns.Item(0).SortOrder = 1
oG2antt.EndUpdate()
|
|
2118
|
Can I sort the column by image
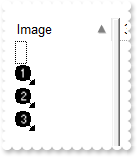
OleObject oG2antt,var_Column,var_Items

oG2antt = ole_1.Object
oG2antt.BeginUpdate()
oG2antt.Images("gBJJgBAIDAAGAAEAAQhYAf8Pf4hh0QihCJo2AEZjQAjEZFEaIEaEEaAIAkcbk0olUrlktl0vmExmUzmk1m03nE5nU7nk9n0/oFBoVDolFo1HpFJpVLplNp1PqFRqVTqlVq1XrFZrVbrldr1fsFhsVjslls1ntFptVrtltt1vuFxuVzul1u13vF5vV7vl9v1/wGBwWDwmFw2HxGJxWLxmNx0xiFdyOTh8Tf9ZymXx+QytcyNgz8r0OblWjyWds+m0ka1Vf1ta1+r1mos2xrG2xeZ0+a0W0qOx3GO4NV3WeyvD2XJ5XL5nN51aiw+lfSj0gkUkAEllHanHI5j/cHg8EZf7w8vl8j4f/qfEZeB09/vjLAB30+kZQAP/P5/H6/yNAOAEAwCjMBwFAEDwJBMDwLBYAP2/8Hv8/gAGAD8LQs9w/nhDY/oygIA=")
var_Column = oG2antt.Columns.Add("Image")
	var_Column.SortType = 48
var_Items = oG2antt.Items
	var_Items.CellImage(var_Items.AddItem(),0,3)
	var_Items.AddItem()
	var_Items.CellImage(var_Items.AddItem(),0,1)
	var_Items.CellImage(var_Items.AddItem(),0,2)
oG2antt.Columns.Item(0).SortOrder = 1
oG2antt.EndUpdate()
|
|
2117
|
Can I sort the column by value(numeric)
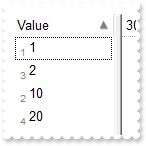
OleObject oG2antt,var_Column,var_Items

oG2antt = ole_1.Object
oG2antt.BeginUpdate()
var_Column = oG2antt.Columns.Add("Value")
	var_Column.Def(17,1)
	var_Column.FormatColumn = "`<fgcolor=808080><off 4><font ;6> ` + (1 index ``)  + ` </font></off></fgcolor>` + value"
	var_Column.SortType = 17 /*exSortByValue | SortNumeric*/
var_Items = oG2antt.Items
	var_Items.AddItem("1")
	var_Items.AddItem("10")
	var_Items.AddItem("2")
	var_Items.AddItem("20")
oG2antt.Columns.Item(0).SortOrder = 1
oG2antt.EndUpdate()
|
|
2116
|
Can I sort a column by cell's state (checked, unchecked) rather than caption
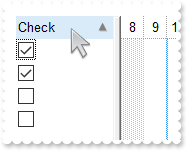
OleObject oG2antt,var_Column,var_Editor,var_Items

oG2antt = ole_1.Object
oG2antt.BeginUpdate()
var_Column = oG2antt.Columns.Add("Check")
	var_Editor = var_Column.Editor
		var_Editor.EditType = 19
		var_Editor.Option(17,1)
	var_Column.SortType = 1
var_Items = oG2antt.Items
	var_Items.AddItem(true)
	var_Items.AddItem(false)
	var_Items.AddItem(false)
	var_Items.AddItem(true)
oG2antt.Columns.Item(0).SortOrder = 1
oG2antt.EndUpdate()
|
|
2115
|
How can I highlight(bold) the items that displays milestones (method 2)
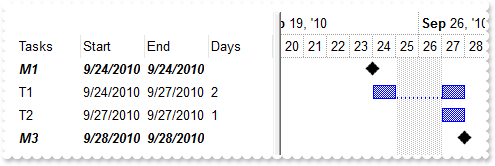
OleObject oG2antt,var_Bar,var_Chart,var_Column,var_Column1,var_Columns,var_ConditionalFormat,var_Items

oG2antt = ole_1.Object
oG2antt.BeginUpdate()
var_Columns = oG2antt.Columns
	var_Columns.Add("Tasks")
	var_Columns.Add("Start").Def(18,1)
	var_Columns.Add("End").Def(18,543)
	var_Column = var_Columns.Add("Days")
		var_Column.Def(18,258)
		var_Column.FormatColumn = "value ? value : ``"
	var_Column1 = var_Columns.Add("Type")
		var_Column1.Def(18,0)
		var_Column1.Visible = false
var_ConditionalFormat = oG2antt.ConditionalFormats.Add("%4 = `Milestone`")
	var_ConditionalFormat.Bold = true
	var_ConditionalFormat.Italic = true
	var_ConditionalFormat.ApplyTo = -1
var_Chart = oG2antt.Chart
	var_Chart.FirstVisibleDate = 2010-09-20
	var_Chart.LevelCount = 2
	var_Chart.PaneWidth(false,256)
	var_Bar = var_Chart.Bars.Add("Task:Split")
		var_Bar.Shortcut = "Task"
		var_Bar.Def(20,true)
var_Items = oG2antt.Items
	var_Items.AllowCellValueToItemBar = true
	var_Items.AddBar(var_Items.AddItem("M1"),"Milestone",2010-09-24,2010-09-24)
	var_Items.AddBar(var_Items.AddItem("T1"),"Task",2010-09-24,2010-09-28)
	var_Items.AddBar(var_Items.AddItem("T2"),"Task",2010-09-27,2010-09-28)
	var_Items.AddBar(var_Items.AddItem("M3"),"Milestone",2010-09-28,2010-09-28)
oG2antt.EndUpdate()
|
|
2114
|
How can I highlight(bold) the items that displays milestones (method 1)
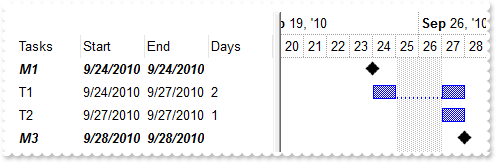
OleObject oG2antt,var_Bar,var_Chart,var_Column,var_Columns,var_ConditionalFormat,var_Items

oG2antt = ole_1.Object
oG2antt.BeginUpdate()
var_Columns = oG2antt.Columns
	var_Columns.Add("Tasks")
	var_Columns.Add("Start").Def(18,1)
	var_Columns.Add("End").Def(18,543)
	var_Column = var_Columns.Add("Days")
		var_Column.Def(18,258)
		var_Column.FormatColumn = "value ? value : ``"
var_ConditionalFormat = oG2antt.ConditionalFormats.Add("%3 = 0")
	var_ConditionalFormat.Bold = true
	var_ConditionalFormat.Italic = true
	var_ConditionalFormat.ApplyTo = -1
var_Chart = oG2antt.Chart
	var_Chart.FirstVisibleDate = 2010-09-20
	var_Chart.LevelCount = 2
	var_Chart.PaneWidth(false,256)
	var_Bar = var_Chart.Bars.Add("Task:Split")
		var_Bar.Shortcut = "Task"
		var_Bar.Def(20,true)
var_Items = oG2antt.Items
	var_Items.AllowCellValueToItemBar = true
	var_Items.AddBar(var_Items.AddItem("M1"),"Milestone",2010-09-24,2010-09-24)
	var_Items.AddBar(var_Items.AddItem("T1"),"Task",2010-09-24,2010-09-28)
	var_Items.AddBar(var_Items.AddItem("T2"),"Task",2010-09-27,2010-09-28)
	var_Items.AddBar(var_Items.AddItem("M3"),"Milestone",2010-09-28,2010-09-28)
oG2antt.EndUpdate()
|
|
2113
|
Bars with gradient shows no border or frame arround. What can be done (method 2)
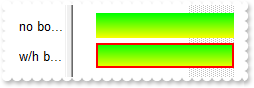
OleObject oG2antt,var_Bar,var_Bar1,var_Items
any h

oG2antt = ole_1.Object
oG2antt.BeginUpdate()
oG2antt.Columns.Add("Task")
oG2antt.Chart.FirstVisibleDate = 2001-01-01
oG2antt.Chart.PaneWidth(false,48)
oG2antt.DefaultItemHeight = 24
var_Bar = oG2antt.Chart.Bars.Add("E1")
	var_Bar.Color = RGB(0,0,0)
	var_Bar.StartColor = RGB(0,255,0)
	var_Bar.EndColor = RGB(255,255,0)
	var_Bar.Pattern = 96 /*exPatternGradientVBox | exPatternBox*/
	var_Bar.Height = 20
var_Bar1 = oG2antt.Chart.Bars.Add("E2")
	var_Bar1.Color = RGB(0,0,0)
	var_Bar1.StartColor = RGB(0,255,0)
	var_Bar1.EndColor = RGB(255,255,0)
	var_Bar1.Pattern = 96 /*exPatternGradientVBox | exPatternBox*/
	var_Bar1.Height = 20
	var_Bar1.Def(53,"[frame=RGB(255,0,0),framethick]")
var_Items = oG2antt.Items
	var_Items.AddItem()
	h = var_Items.AddItem("no border")
	var_Items.AddBar(h,"E1",2001-01-02,2001-01-08,"")
	h = var_Items.AddItem("w/h boder")
	var_Items.AddBar(h,"E2",2001-01-02,2001-01-08,"")
	var_Items.AddItem()
oG2antt.EndUpdate()
|
|
2112
|
Bars with gradient shows no border or frame arround. What can be done (method 1)
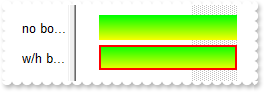
OleObject oG2antt,var_Bar,var_Items
any h

oG2antt = ole_1.Object
oG2antt.BeginUpdate()
oG2antt.Columns.Add("Task")
oG2antt.Chart.FirstVisibleDate = 2001-01-01
oG2antt.Chart.PaneWidth(false,48)
oG2antt.DefaultItemHeight = 24
var_Bar = oG2antt.Chart.Bars.Add("E2")
	var_Bar.Color = RGB(0,0,0)
	var_Bar.StartColor = RGB(0,255,0)
	var_Bar.EndColor = RGB(255,255,0)
	var_Bar.Pattern = 96 /*exPatternGradientVBox | exPatternBox*/
	var_Bar.Height = 20
var_Items = oG2antt.Items
	var_Items.AddItem()
	h = var_Items.AddItem("no border")
	var_Items.AddBar(h,"E2",2001-01-02,2001-01-08,"")
	h = var_Items.AddItem("w/h boder")
	var_Items.AddBar(h,"E2",2001-01-02,2001-01-08,"")
	var_Items.ItemBar(h,"",53,"[frame=RGB(255,0,0),framethick]")
	var_Items.AddItem()
oG2antt.EndUpdate()
|
|
2111
|
Is it possible to display auto-numbers (rows-numbers) for non-empty items only
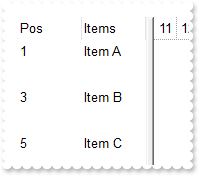
OleObject oG2antt,var_Column,var_Columns,var_Items

oG2antt = ole_1.Object
oG2antt.BeginUpdate()
oG2antt.Chart.PaneWidth(false,128)
var_Columns = oG2antt.Columns
	var_Columns.Add("Items")
	var_Column = var_Columns.Add("Pos")
		var_Column.FormatColumn = "len(%C0) ? 1 pos `` : ``"
		var_Column.Position = 0
var_Items = oG2antt.Items
	var_Items.AddItem("Item A")
	var_Items.AddItem("")
	var_Items.AddItem("Item B")
	var_Items.AddItem("")
	var_Items.AddItem("Item C")
oG2antt.EndUpdate()
|
|
2110
|
Is it possible to separate the group of items using horizontal-lines (root-items)
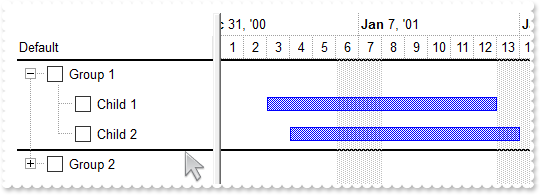
OleObject oG2antt,var_Chart,var_Column,var_Column1,var_Columns,var_ConditionalFormat,var_Items
any h

oG2antt = ole_1.Object
oG2antt.BeginUpdate()
oG2antt.VisualAppearance.Add(1,"gBFLBCJwBAEHhEJAAEhABLEIQAAYAQGKIcBiAKBQAGaAoDgYN4MAANAwjJBMKgBBCLIxhEYobgmGIaRiAUbQSKEPxLEiPmqSHIEWwtDiBZgieTpNhAMg1CTNU4RAKoYRzBKeZ7kGZIVjKMofURRDpxBBMAkB")
oG2antt.LinesAtRoot = -1
oG2antt.DefaultItemHeight = 24
oG2antt.SelBackMode = 1
var_Chart = oG2antt.Chart
	var_Chart.FirstVisibleDate = 2001-01-01
	var_Chart.LevelCount = 2
	var_Chart.PaneWidth(false,196)
	var_Chart.SelBackColor = oG2antt.SelBackColor
var_Columns = oG2antt.Columns
	var_Column = var_Columns.Add("Default")
		var_Column.Def(0,true)
		var_Column.PartialCheck = true
	var_Column1 = var_Columns.Add("Position")
		var_Column1.FormatColumn = "1 + ((1 rpos ``) contains `.`)"
		var_Column1.Visible = false
var_ConditionalFormat = oG2antt.ConditionalFormats.Add("%C1")
	var_ConditionalFormat.BackColor = 16777216 /*0x1000000*/
	var_ConditionalFormat.ChartBackColor = var_ConditionalFormat.BackColor
var_Items = oG2antt.Items
	h = var_Items.AddItem("Group 1")
	var_Items.AddBar(var_Items.InsertItem(h,,"Child 1"),"Task",2001-01-03,2001-01-13)
	var_Items.AddBar(var_Items.InsertItem(h,,"Child 2"),"Task",2001-01-04,2001-01-14)
	var_Items.ExpandItem(h,true)
	h = var_Items.AddItem("Group 2")
	var_Items.AddBar(var_Items.InsertItem(h,,"Child 1"),"Task",2001-01-03,2001-01-13)
	var_Items.AddBar(var_Items.InsertItem(h,,"Child 2"),"Task",2001-01-04,2001-01-14)
oG2antt.EndUpdate()
|
|
2109
|
How can specify a black pattern for the task
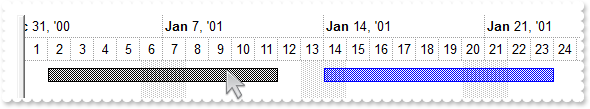
OleObject oG2antt,var_Chart,var_Items
any h

oG2antt = ole_1.Object
oG2antt.BeginUpdate()
oG2antt.DefaultItemHeight = 22
var_Chart = oG2antt.Chart
	var_Chart.FirstVisibleDate = 2001-01-01
	var_Chart.LevelCount = 2
	var_Chart.PaneWidth(false,0)
oG2antt.Columns.Add("Frames")
var_Items = oG2antt.Items
	h = var_Items.AddItem("Task")
	var_Items.AddBar(h,"Task",2001-01-02,2001-01-12,"bar A")
	var_Items.ItemBar(h,"bar A",33,1)
	var_Items.AddBar(h,"Task",2001-01-14,2001-01-24,"bar B")
oG2antt.EndUpdate()
|
|
2108
|
Can I define a bar so it automatically fills the current item/row height (same height)
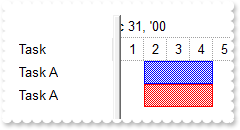
OleObject oG2antt,var_Chart,var_Items
any h

oG2antt = ole_1.Object
oG2antt.BeginUpdate()
oG2antt.Columns.Add("Task")
var_Chart = oG2antt.Chart
	var_Chart.LevelCount = 2
	var_Chart.PaneWidth(false,96)
	var_Chart.FirstVisibleDate = 2001-01-01
	var_Chart.Bars.Item("Task").Height = -1
var_Items = oG2antt.Items
	var_Items.AddBar(var_Items.AddItem("Task A"),"Task",2001-01-02,2001-01-05)
	h = var_Items.AddItem("Task A")
	var_Items.AddBar(h,"Task",2001-01-02,2001-01-05,"")
	var_Items.ItemBar(h,"",33,255)
oG2antt.EndUpdate()
|
|
2107
|
How can I highlight a specified date for the entire chart (Method 2)
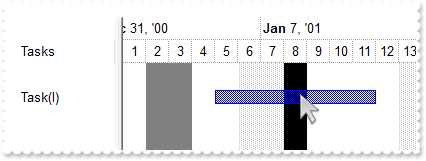
OleObject oG2antt,var_Chart,var_Items
any h

oG2antt = ole_1.Object
oG2antt.BeginUpdate()
oG2antt.Columns.Add("Tasks")
var_Chart = oG2antt.Chart
	var_Chart.FirstVisibleDate = 2001-01-01
	var_Chart.PaneWidth(false,96)
	var_Chart.UnitWidth = 18
	var_Chart.LevelCount = 2
	var_Chart.MarkTimeZone("zone1",2001-01-08,2001-01-09,0)
	var_Chart.MarkTimeZone("zone2",2001-01-02,2001-01-04,0,"50")
var_Items = oG2antt.Items
	var_Items.AddItem("")
	h = var_Items.AddItem("Task(I)")
	var_Items.AddBar(h,"Task",2001-01-05,2001-01-12,"I")
	var_Items.AddItem("")
oG2antt.EndUpdate()
|
|
2106
|
How can I highlight a specified date for the entire chart, including the header (Method 1)
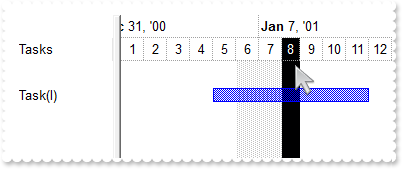
OleObject oG2antt,var_Chart,var_InsideZoomFormat,var_InsideZooms,var_Items
any h

oG2antt = ole_1.Object
oG2antt.BeginUpdate()
oG2antt.Columns.Add("Tasks")
var_Chart = oG2antt.Chart
	var_Chart.FirstVisibleDate = 2001-01-01
	var_Chart.PaneWidth(false,96)
	var_Chart.UnitWidth = 18
	var_Chart.LevelCount = 2
	var_Chart.AllowInsideZoom = true
	var_Chart.AllowResizeInsideZoom = false
	var_Chart.InsideZoomOnDblClick = false
	var_InsideZoomFormat = var_Chart.DefaultInsideZoomFormat
		var_InsideZoomFormat.ForeColor = RGB(255,255,255)
		var_InsideZoomFormat.BackColorChart = RGB(0,0,1)
		var_InsideZoomFormat.BackColor = RGB(0,0,1)
	var_InsideZooms = var_Chart.InsideZooms
		var_InsideZooms.SplitBaseLevel = false
		var_InsideZooms.DefaultWidth = 18
		var_InsideZooms.Add(2001-01-08).AllowInsideFormat = false
var_Items = oG2antt.Items
	var_Items.AddItem("")
	h = var_Items.AddItem("Task(I)")
	var_Items.AddBar(h,"Task",2001-01-05,2001-01-12,"I")
	var_Items.AddItem("")
oG2antt.EndUpdate()
|
|
2105
|
How can I highlight a specified date of a specified item
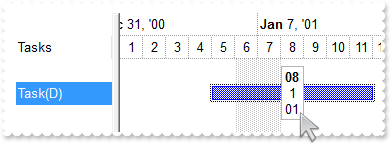
OleObject oG2antt,var_Chart,var_Items,var_Note,var_Notes
any h

oG2antt = ole_1.Object
oG2antt.BeginUpdate()
oG2antt.Columns.Add("Tasks")
var_Chart = oG2antt.Chart
	var_Chart.FirstVisibleDate = 2001-01-01
	var_Chart.PaneWidth(false,96)
	var_Chart.UnitWidth = 18
	var_Chart.LevelCount = 2
var_Items = oG2antt.Items
	var_Items.AddItem("")
	h = var_Items.AddItem("Task(D)")
	var_Items.AddBar(h,"Task",2001-01-05,2001-01-12,"D")
	var_Items.AddItem("")
var_Notes = oG2antt.Chart.Notes
	var_Note = var_Notes.Add("NoteD",h,2001-01-08,"<b><%dd%></b><br><%m%><br><%yy%>")
		var_Note.PartFixedWidth(1,18)
		var_Note.PartShadow(1,false)
oG2antt.EndUpdate()
|
|
2104
|
How can I display the start/end of the task within its margins (notes)
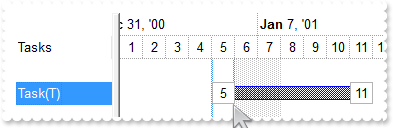
OleObject oG2antt,var_Chart,var_Items,var_Note,var_Note1,var_Notes
any h

oG2antt = ole_1.Object
oG2antt.BeginUpdate()
oG2antt.Columns.Add("Tasks")
var_Chart = oG2antt.Chart
	var_Chart.FirstVisibleDate = 2001-01-01
	var_Chart.PaneWidth(false,96)
	var_Chart.UnitWidth = 18
	var_Chart.LevelCount = 2
var_Items = oG2antt.Items
	var_Items.AddItem("")
	h = var_Items.AddItem("Task(T)")
	var_Items.AddBar(h,"Task",2001-01-05,2001-01-12,"T")
	var_Items.AddItem("")
var_Notes = oG2antt.Chart.Notes
	var_Note = var_Notes.Add("NoteTS",h,"T","")
		var_Note.ShowLink = 0
		var_Note.PartText(0,"<%d%>")
		var_Note.PartHOffset(0,9)
		var_Note.PartFixedWidth(0,18)
	var_Note1 = var_Notes.Add("NoteTE",h,"T","")
		var_Note1.RelativePosition = "E-1"
		var_Note1.ShowLink = 0
		var_Note1.PartText(0,"<%d%>")
		var_Note1.PartHOffset(0,9)
		var_Note1.PartFixedWidth(0,18)
oG2antt.EndUpdate()
|
|
2103
|
Is it possible to show the tasks not-overlaid when the item is collapsed and overlaid once the user expands the item
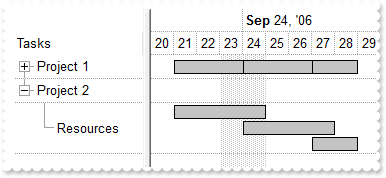
/*begin event BeforeExpandItem(long  Item, any  Cancel) - Fired before an item is about to be expanded (collapsed).*/
/*
	oG2antt = ole_1.Object
	oG2antt.Refresh()
*/
/*end event BeforeExpandItem*/

OleObject oG2antt,var_Bar,var_Chart,var_Items
any h,h1

oG2antt = ole_1.Object
oG2antt.BeginUpdate()
oG2antt.Indent = 16
oG2antt.LinesAtRoot = -1
oG2antt.HasLines = 1
oG2antt.DrawGridLines = 1
oG2antt.Columns.Add("Tasks")
var_Chart = oG2antt.Chart
	var_Chart.FirstVisibleDate = 2006-09-20
	var_Chart.ShowCollapsedBars = true
	var_Chart.LevelCount = 2
	var_Chart.PaneWidth(false,128)
	var_Chart.DrawGridLines = 1
	var_Bar = var_Chart.Bars.Item("Task")
		var_Bar.OverlaidType = 3
		var_Bar.Color = RGB(0,0,0)
		var_Bar.StartColor = RGB(196,196,196)
		var_Bar.EndColor = RGB(196,196,196)
		var_Bar.Pattern = 32
var_Items = oG2antt.Items
	h = var_Items.AddItem("Project 1")
	h1 = var_Items.InsertItem(h,,"Resources")
	var_Items.AddBar(h1,"Task",2006-09-21,2006-09-25,"A")
	var_Items.AddBar(h1,"Task",2006-09-24,2006-09-28,"B")
	var_Items.AddBar(h1,"Task",2006-09-27,2006-09-29,"C")
	h = var_Items.AddItem("Project 2")
	h1 = var_Items.InsertItem(h,,"Resources")
	var_Items.AddBar(h1,"Task",2006-09-21,2006-09-25,"A")
	var_Items.AddBar(h1,"Task",2006-09-24,2006-09-28,"B")
	var_Items.AddBar(h1,"Task",2006-09-27,2006-09-29,"C")
	var_Items.ExpandItem(h,true)
oG2antt.EndUpdate()
|
|
2102
|
Is it possible to display the label of the level without truncating / no clip
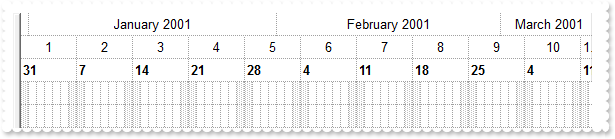
OleObject oG2antt,var_Chart,var_Level,var_Level1,var_Level2

oG2antt = ole_1.Object
oG2antt.BeginUpdate()
var_Chart = oG2antt.Chart
	var_Chart.FirstWeekDay = 0
	var_Chart.FirstVisibleDate = 2000-12-31
	var_Chart.PaneWidth(false,0)
	var_Chart.LevelCount = 3
	var_Level = var_Chart.Level(0)
		var_Level.Label = 16
		var_Level.FormatLabel = "`<c>` + value"
	var_Level1 = var_Chart.Level(1)
		var_Level1.Label = 256
		var_Level1.FormatLabel = "`<c>` + value"
	var_Level2 = var_Chart.Level(2)
		var_Level2.Alignment = 256 /*0x100 | */
		var_Level2.FormatLabel = "weekday(dvalue) = 0 ? `<b>` + value : ``"
		var_Level2.DrawTickLines = 0
		var_Level2.DrawTickLinesFrom(1,1)
		var_Level2.DrawGridLines = true
	var_Chart.UnitWidth = 6
	var_Chart.DrawGridLines = -1
oG2antt.EndUpdate()
|
|
2101
|
How do I get the item's auto-number, when using FormatColumn property, as CellValue gets empty
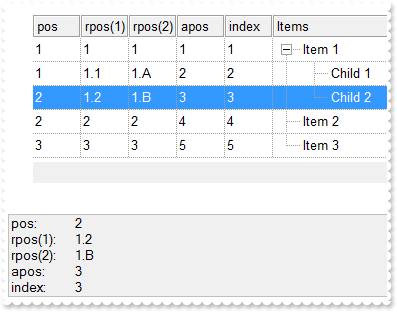
/*begin event SelectionChanged() - Fired after a new item has been selected.*/
/*
	OleObject var_Items
	oG2antt = ole_1.Object
	var_Items = oG2antt.Items
		MessageBox("Information",string( "pos: " ))
		MessageBox("Information",string( var_Items.CellCaption(var_Items.FocusItem,1) ))
		MessageBox("Information",string( "rpos(1): " ))
		MessageBox("Information",string( var_Items.CellCaption(var_Items.FocusItem,2) ))
		MessageBox("Information",string( "rpos(2): " ))
		MessageBox("Information",string( var_Items.CellCaption(var_Items.FocusItem,3) ))
		MessageBox("Information",string( "apos: " ))
		MessageBox("Information",string( var_Items.CellCaption(var_Items.FocusItem,4) ))
		MessageBox("Information",string( "index: " ))
		MessageBox("Information",string( var_Items.CellCaption(var_Items.FocusItem,5) ))
*/
/*end event SelectionChanged*/

OleObject oG2antt,var_Column,var_Column1,var_Column2,var_Column3,var_Column4,var_Columns,var_Items
any h,hSel

oG2antt = ole_1.Object
oG2antt.BeginUpdate()
oG2antt.LinesAtRoot = -1
oG2antt.DrawGridLines = -2
oG2antt.HeaderAppearance = 4
var_Columns = oG2antt.Columns
	var_Columns.Add("Items")
	var_Column = var_Columns.Add("pos")
		var_Column.FormatColumn = "1 pos ``"
		var_Column.Position = 0
		var_Column.Width = 48
		var_Column.AllowSizing = false
	var_Column1 = var_Columns.Add("rpos(1)")
		var_Column1.FormatColumn = "1 rpos ``"
		var_Column1.Position = 1
		var_Column1.Width = 48
		var_Column1.AllowSizing = false
	var_Column2 = var_Columns.Add("rpos(2)")
		var_Column2.FormatColumn = "1 rpos `.||A-Z`"
		var_Column2.Position = 2
		var_Column2.Width = 48
		var_Column2.AllowSizing = false
	var_Column3 = var_Columns.Add("apos")
		var_Column3.FormatColumn = "1 apos ``"
		var_Column3.Position = 3
		var_Column3.Width = 48
		var_Column3.AllowSizing = false
	var_Column4 = var_Columns.Add("index")
		var_Column4.FormatColumn = "1 index ``"
		var_Column4.Position = 4
		var_Column4.Width = 48
		var_Column4.AllowSizing = false
var_Items = oG2antt.Items
	h = var_Items.AddItem("Item 1")
	var_Items.InsertItem(h,,"Child 1")
	hSel = var_Items.InsertItem(h,,"Child 2")
	var_Items.ExpandItem(h,true)
	var_Items.AddItem("Item 2")
	var_Items.AddItem("Item 3")
oG2antt.EndUpdate()
oG2antt.Items.SelectItem(hSel,true)
|